At Replay.io we’re building time travel enabled Browser DevTools. Time-travel lets us add debugging features like retroactive print statements. Time-travel also solves the reproducibility problem because you can now share replays with your team.
But, what exactly is time travel? How do we ensure we can reliably record and deterministically replay any website?
How we record and replay
Most of the code we write is deterministic. If you want to replay
fibonacci 10 you can simply re-run it. If you re-wrote fibonacci so instead of receiving the input, it read it from a file, you’d need to start recording fopen, fread, and fclose. At Replay.io, we record and replay browser tabs and node scripts. So instead of recording
fibonacci we’re recording content processes like Chrome: 10s of millions of lines of C++ responsible for JavaScript, Graphics, Networking, DOM, Layout, etc. But the same principles apply.It turns out that if you can record about ~400 libc calls, you’re pretty close to being able to record and replay a browser tab. The remaining non-determinism is introduced by inter-process communication and non-deterministic data structures like Hash Tables that rely on pointers.
We aim to deterministically replay at the JS level, not at the C++ level. This means that it’s okay if, for example, Chrome’s GC performs sweeps at different times while replaying as long as from the perspective of the web application everything is the same. Promises should resolve in the same order. Worker messages should be received in the same order. But if you connect LLDB to a recording of Chrome, you’ll notice that it runs in a different way each time. This lossiness is a feature and is critical to achieving a real time low overhead recording.
If you’d like to dive a lot deeper into how our recorder works, we wrote a three part series here.
How do we improve our recorder
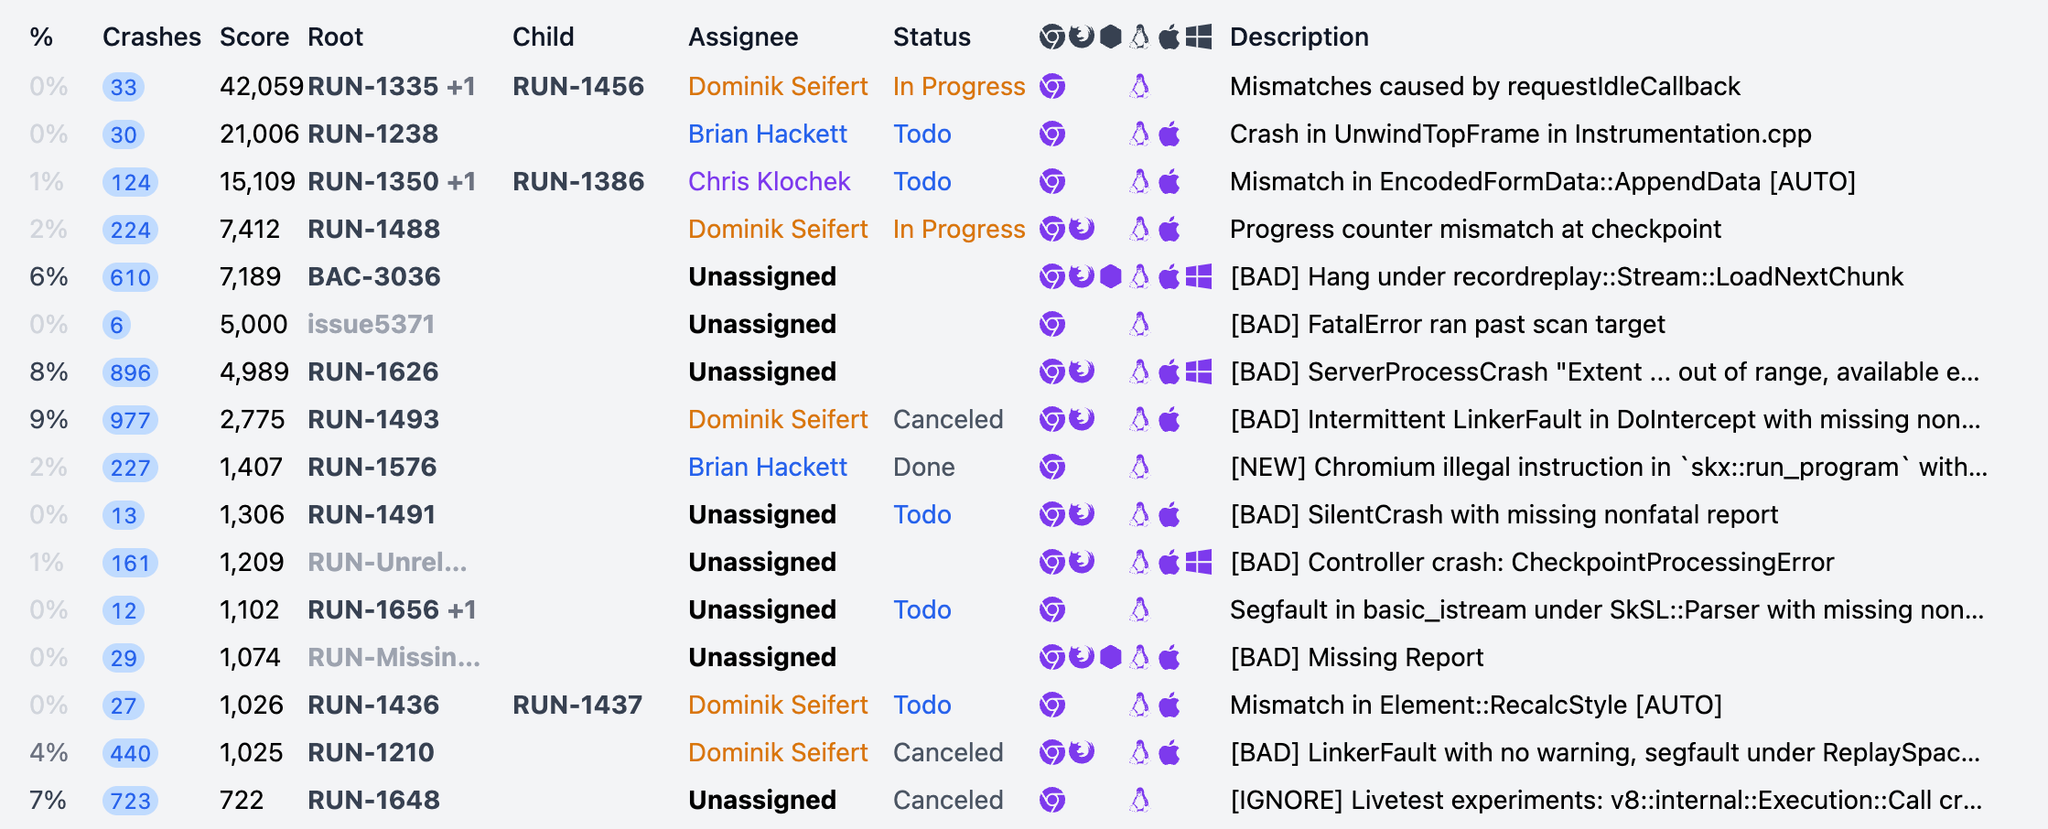
Because our recorder is lossy, we need to take an empirical approach to replayability. We run a fairly large test suite daily, categorize the crashes that come in, add diagnostics that help us narrow the problems down, and add fixes that make Chrome more deterministic. It is fairly easy to see what our crash rate is, how many crashes are categorized, and for each class of issues, how many diagnostics we’ve added.
The technical term for a crash is a divergence. We detect divergences by placing
asserts in Chrome which act like print statements. When we get an assert in a different order while replaying we know that we’ve diverged.When we want to narrow down a divergence, we go in and add more asserts. Here is an example of some asserts Dominik added recently to better understand an issue we’re seeing in the
PictureLayerTilingSet component.c++bool PictureLayerImpl::UpdateTiles() { // https://linear.app/replay/issue/RUN-550 recordreplay::Assert("[RUN-550] PictureLayerImpl::UpdateTiles Start %d", id()); if (!CanHaveTilings()) { // https://linear.app/replay/issue/RUN-550 recordreplay::Assert("[RUN-550] PictureLayerImpl::UpdateTiles #1"); ideal_page_scale_ = 0.f; ideal_device_scale_ = 0.f; ideal_contents_scale_ = gfx::Vector2dF(0.f, 0.f); ideal_source_scale_ = gfx::Vector2dF(0.f, 0.f); SanityCheckTilingState(); return false; }
In this case, if
UpdateTiles is called in a different order while replaying we might get this stream while recordingc++"[RUN-550] PictureLayerImpl::UpdateTiles Start 1" "[RUN-550] PictureLayerImpl::UpdateTiles #1" "[RUN-550] PictureLayerImpl::UpdateTiles Start 2" "[RUN-550] PictureLayerImpl::UpdateTiles #1" "[RUN-550] PictureLayerImpl::UpdateTiles Start 3" "[RUN-550] PictureLayerImpl::UpdateTiles #1"
and this new stream while replaying
c++"[RUN-550] PictureLayerImpl::UpdateTiles Start 1"
"[RUN-550] PictureLayerImpl::UpdateTiles #1"
"[RUN-550] PictureLayerImpl::UpdateTiles Start 3" <--- notice how 2 & 3 swapped
"[RUN-550] PictureLayerImpl::UpdateTiles #1"
"[RUN-550] PictureLayerImpl::UpdateTiles Start 2"
"[RUN-550] PictureLayerImpl::UpdateTiles #1"
The process for narrowing down a divergence is iterative and somewhat mechanical. But if you know where to look, you can quickly narrow it down to a source of raciness or memory reference.
How do we model our crash rate?
At a high-level, it is fairly easy to know how well we’re doing. You can simply look at what % of recordings we are able to successfully replay.
This problem is similar to looking at a leaky bucket. You don’t need to know how many holes there are or how big they are to know how leaky the bucket is. You can simply look at how quickly the water flows out of the bucket.
However once you want to actually plug the holes in the bucket, it’s helpful to know how many there are and which ones are biggest in order to prioritize your efforts. In our case, we want to know how many sources of non-determinism we have and how significant they are.

Today we have 96 known issues in Chrome and we estimate that there are 162 remaining issues. When we look at the distribution of crashes across issues, we see that 30% of the issues account for 80% of our crashes. This is great because it means we only need to fix 38 issues in order to reduce our crash rate by 80%. An 80/30 is not as good as an 80/20 power curve, but we’ll take it!

Setting an end date
The purpose of models is to predict the future. Once we have an idea of how many issues we have, we can begin measuring how long it takes for us to fix any given issue and begin to predict how long it will take for us to fix our top 30% of issues and reduce our crash rate by 80%.


