
Optimizing web pages is pretty challenging. Except in the simplest cases, it requires a lot of manual work to understand what is happening on the page and identify areas for improvement. The basic reason for these difficulties is the limitations of existing tools, which are descriptive but not explanatory. These tools can show all the events that happened while loading a page, but this is both less and more information than needed. Less in that the tools can’t say why an event happened or what effect it has on the page’s performance, and more in that events that are irrelevant to improving performance are mixed in with events that are critically important.
We propose a new and more explanatory abstraction, a limiting path, which lists the events that must occur in sequence before a web page loads or responds to user input. The only way to speed up the page is to optimize the limiting path; other unrelated events can be ignored. Replay’s upcoming performance analysis is centered on limiting paths: it computes these paths for any event of interest in a recording of a page’s execution, and analyzes how time was spent along the path. This makes it easy both to optimize the page and to precisely identify performance regressions, including in CI.
While these techniques apply to any web page, our focus is on React applications, which have a lot of implicit and asynchronous behavior that is difficult to understand and optimize.
In the rest of this post we’ll describe a real world regression in Replay’s devtools we investigated, the limitations of existing tooling investigating this regression, and how limiting paths highlight the problem immediately. Our main focus is on network regressions, but towards the end we also discuss overhead due to main thread computation.
Replay’s performance analysis will enter closed beta this summer. Join our waitlist here to get access when it’s available.
The Regression
A recent change to Replay’s devtools added the logic below to the App function which is used to render one of the top level React components in the devtools.
javascriptconst App = ({ apiKey }) => {
  // ... initialization ...

  const [token, setToken] = useState(apiKey ? { token: apiKey } : undefined);
  useEffect(() => {
    async function fetchToken() {
      const response = await fetch("/api/token");
      const token = response.ok ? await response.text() : undefined;
      setToken({ token });
    }
    if (!token) {
      fetchToken();
    }
  }, [token, setToken]);

  if (!token) {
    return;
  }

  // ... continue rendering page components ...
};
This change does not impact the rendering flow when the user is already logged in, but when the user is not logged in it has the effect of creating an extra network call that blocks the page from loading.
When the user is not logged in the
apiKey prop will be null, and the first time the App component renders an early return is taken because no token is available. The useEffect hook runs after the first render, triggers a fetch on /api/token, and when that fetch returns the token will be set. This triggers a rerender of the component with the new token and the page load resumes.Waterfall Woes
The main tool developers have to investigate network related performance issues is a network waterfall chart, which is available in Chrome’s devtools as well as other performance tools. Below is a waterfall for loading Replay’s devtools with the above regression present.
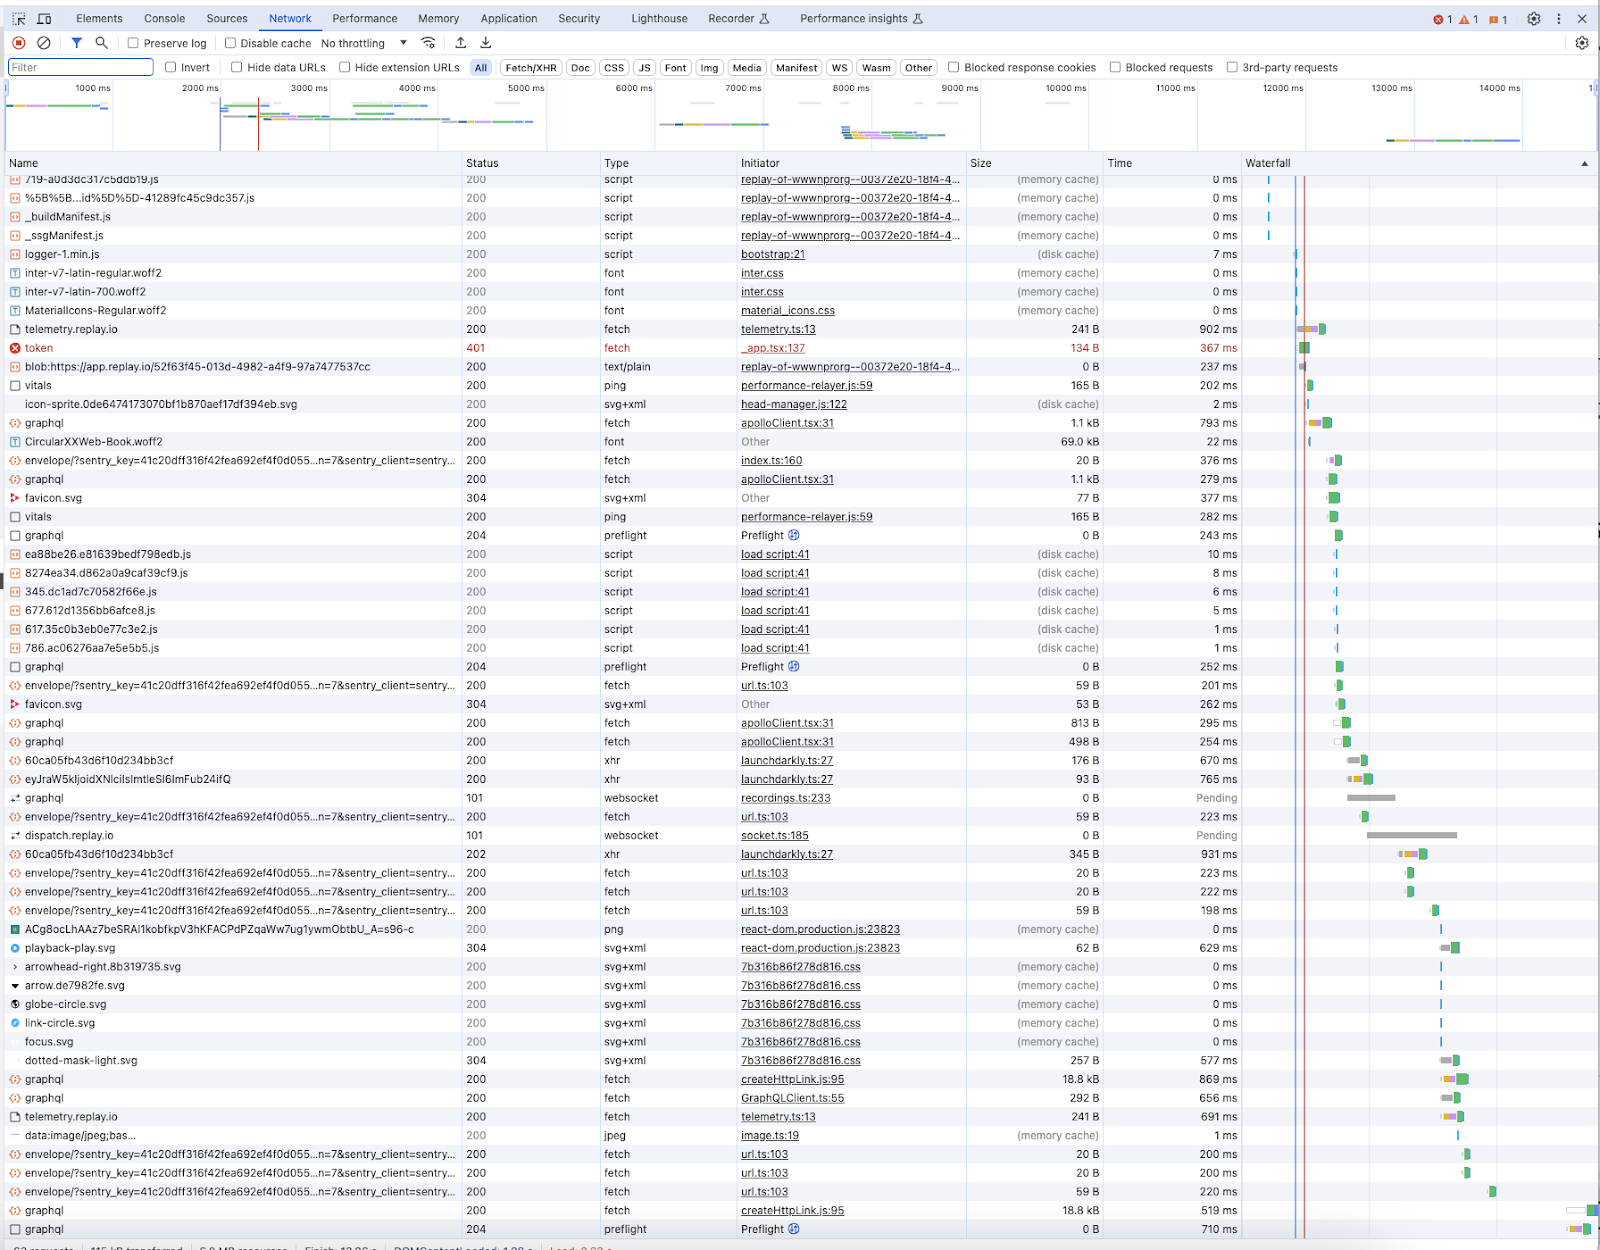
Each row in this chart is a network request, with columns for the request information and the waterfall itself on the right to show timings for when each request was initiated and later completed.
Squinting at the chart and comparing it to one without the regression shows the new fetch call for “token”. The size of this transfer is 134 bytes and it took 367 ms. The presence of a new network request like this isn’t a meaningful regression by itself – it’s a tiny request and isn’t going to impact other network activity on the page. The problem is that the new request blocks other later requests that cause the page to continue loading.
The waterfall chart does not indicate whether this request blocks the page from continuing to load. Examining the timings for the requests shows that later requests required for the page to load don’t start until after the “token” request finishes, but that doesn’t mean there is actually a new requirement in the app that the “token” request must finish before those other requests can start. Moreover, comparing these times requires knowing which later requests are required for the page to load.
Actually determining whether the new request is a meaningful regression requires studying the code by hand to understand the loading sequence and that the new request is a blocking one. The waterfall doesn’t provide this information.
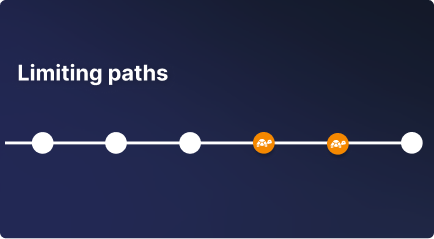
Limiting Paths
Let’s consider a different abstraction for what is happening while the page loads. Instead of seeing everything that is going on, we’ll focus on a specific goal event we’re interested in, the page finishing loading. What does this event depend on that limits it from happening faster?
This is a single event in a sea of millions of others. These events have ordering dependencies on each other: if event A depends on event B, then B must happen before A. We can treat these dependencies as edges in an acyclic dependency graph between events. In this graph the ancestors of A are everything that must occur before A does, and the descendants of A are everything that must happen after A does.
We’re generally not interested in the entire dependency graph or subgraphs. Instead we want to follow chains of dependencies from a goal event back to a root event, something that happens spontaneously without depending on anything else (like the page starting to load, or a user event like a mouse click). The events on the chain form a limiting path: they must occur in sequence before the goal event occurs.
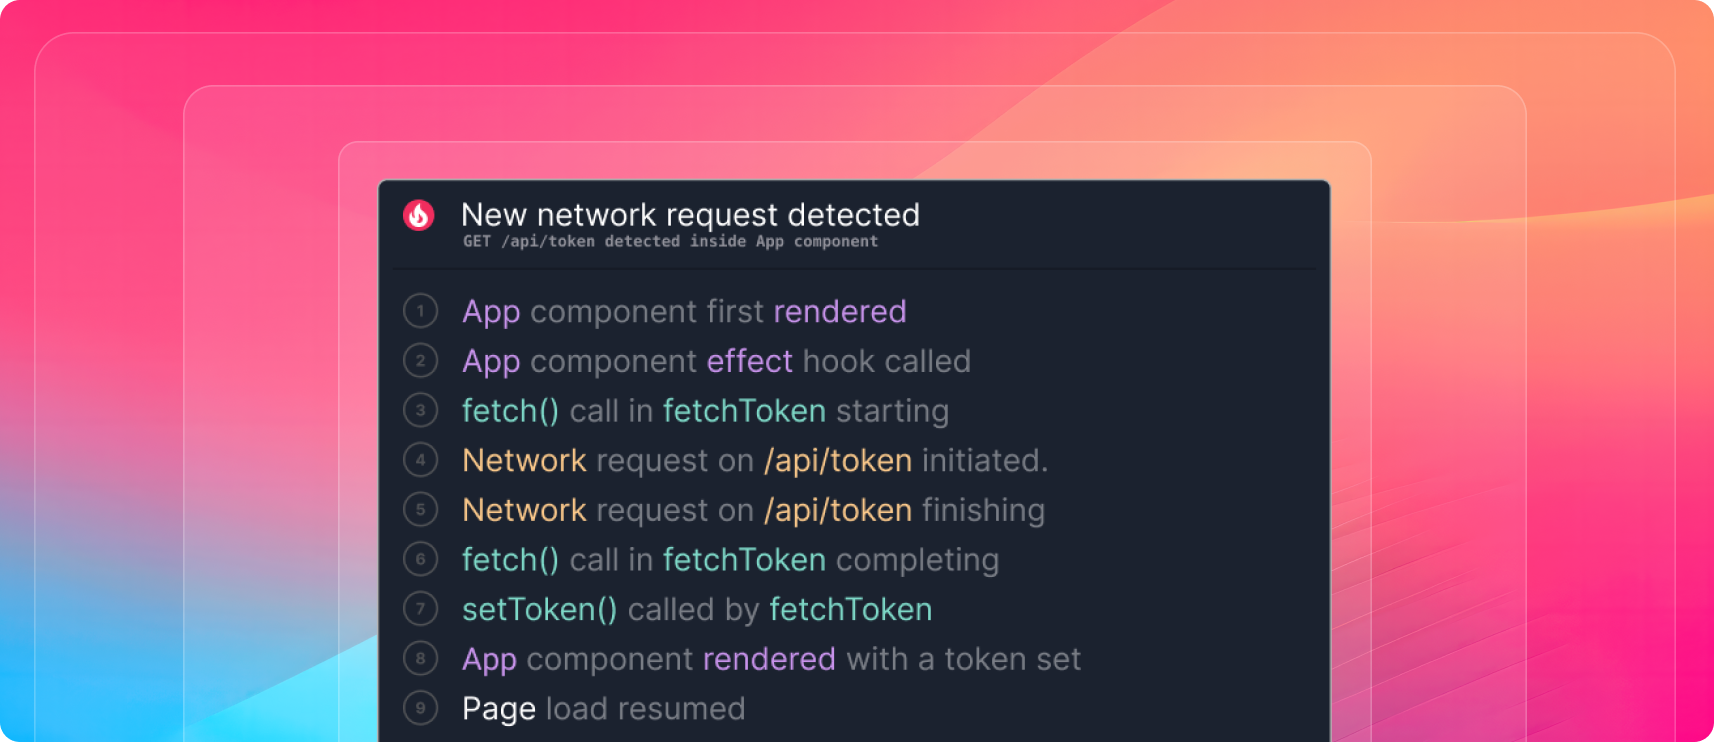
Considering the App component from earlier, we can construct a limiting path by following dependencies from the page load resuming back to when the component first rendered. Here are the events on this path in the order they happened:
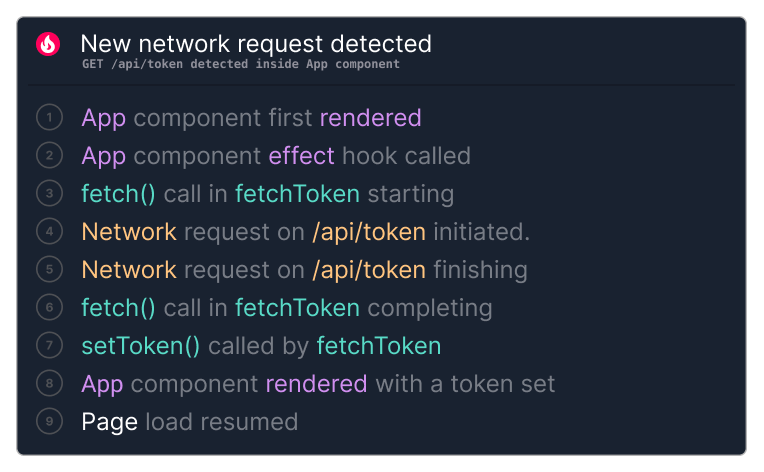
This path directly indicates that the page load resuming depends on the /api/token network request finishing.
Limiting Paths vs Critical Paths
Limiting paths are closely related to the critical paths used in project planning. When considering all the dependencies involved in order to accomplish a goal, the critical path is the path through the dependency graph with the longest total delay, and indicates the minimum time to the goal.
The limiting path cannot be shorter than the critical path, but it can be longer if it includes tasks that are unnecessary for the goal, or tasks which run serially but could run in parallel. Fixing problems like this is one of the best ways to optimize an application.
Analyzing Dependencies
The core of Replay’s performance analysis computes limiting paths for any event in a recording. The approach is conceptually simple: given an event, compute the best dependency for it (which must have happened earlier in the recording), add it to the path, and keep going until a root event is found.
The complexity here arises when computing the best dependency for a given event. There is a variety of dependencies which can be computed and selecting the best one needs an understanding of both the browser’s internal behavior and different JS libraries which the page might be using.
The React dependencies above are an example of the more complex kinds of edges the analysis uses to explain what is happening on the page. Let’s consider the edge above from 8 ⇒ 7, where the App component rendering a second time depends on a
setToken call made earlier.Capturing this requires modeling the semantics of React’s API, with some dependence on React’s internal details.
- We need to determine that the App call happens while rendering a component, and identify the internal React object representing that component. Looking at the internal React frame which called App gets us both of these.
- We need to identify the point where the component was queued for rendering asynchronously. This could be the place where the component was created, a place where the state changed on the component or one of its parents, or several other things. The analysis can find all these places that trigger renders, and get the most recent one which triggered a render on the target component.
- The most recent trigger is from the
setTokencall made byfetchToken. This is the best dependency for the App being rerendered.
This sort of detailed analysis can’t realistically be performed while the page is still running without adding a lot of overhead and affecting the performance data being measured. React alone may perform tens of thousands of operations while initially loading a page, and there could be millions of events in the dependency graph to track. Replay avoids this problem by analyzing recorded executions, which are captured with low overhead and then examined later down to the finest detail.
Identifying Regressions
Once we have limiting paths for the app loading, we can easily identify regressions like the one we examined earlier. The limiting path with the new code will have an extra network request for
/api/token which the path before the new code was added will not have. Because it’s on the limiting path we know the app load time is limited by the request being made and that the new request is a meaningful regression.Identifying regressions this way has two very useful properties.
First, we can eliminate false negatives: all meaningful regressions will be reported. If the limiting path is computed accurately, along each link we can exactly characterize the time spent as either waiting for a network request to complete, waiting while the main thread is synchronously doing some computation, or (rarely) waiting for a timer to fire. Regressions either slow down these links (like more network data transferred in a request, slower backend responses, or more main thread compute) or add links (like new network requests), both of which are easy to find.
Second, we can also eliminate false positives: only meaningful regressions will be reported. Anything slowing down the limiting path directly impacts how long the app takes to load and is a meaningful regression. Anything not on the limiting path is irrelevant to how long the app takes to load and can be ignored, with one exception: network requests happening simultaneously with the network requests on the limiting path are competing for shared network resources. We need to watch for regressions in the total amount of network data transferred by such parallel requests, but can ignore their other attributes like timing and duration.
This precision lets us reliably catch performance regressions in CI. Traditionally, catching performance regressions in CI is difficult due to a dependence on time based measurements, which tend to be noisy. Looking for changes in the limiting path avoids this and allows the performance analysis to immediately identify and explain performance regressions before they reach production and impact users.
Beyond the Network
Our focus has been on using limiting paths to identify the network requests required for a page to load, but time spent in main thread computations can also significantly slow a page down. Understanding this is especially important for optimizing user interactions: when a user clicks on a button, how long is it before the next paint (INP) or before the app finishes all updates related to the click? We can compute limiting paths for these which trace the steps involved back to the interaction, which often involve a lot of main thread computation.
Using Replay we can analyze a limiting path and slice up the time along it to characterize how that time was spent, down to fractions of a millisecond. During time slices when the path is waiting on a network request to finish it doesn’t matter what the main thread is doing, but most other time slices are due to main thread compute, either long running synchronous tasks on the limiting path or delays before scheduled tasks execute due to main thread contention.
We can precisely characterize what the main thread is doing in the time slices when it slows down a limiting path. Timing based measurements (again, very noisy) are less interesting than the higher level operations that are going on, especially because we can determine why the main thread is doing those high level operations.
This is especially important for understanding React’s performance characteristics. There are many common performance problems which React apps have and which affect both new and experienced React developers alike. Debugging these is difficult, for the same reasons that debugging other performance problems on a page is difficult: inadequate tools that tell you what is going on but not why.
Using the same techniques we use to understand React dependencies, we can characterize everything React is doing in a time span of interest, why it is doing those things, and point out the issues slowing things down the most like unnecessary rendering and excessive hook calls. With this analysis in place, building high performance React apps and preventing regressions will be a breeze.
Join our waitlist here to get access to Replay’s performance analysis when it’s available.