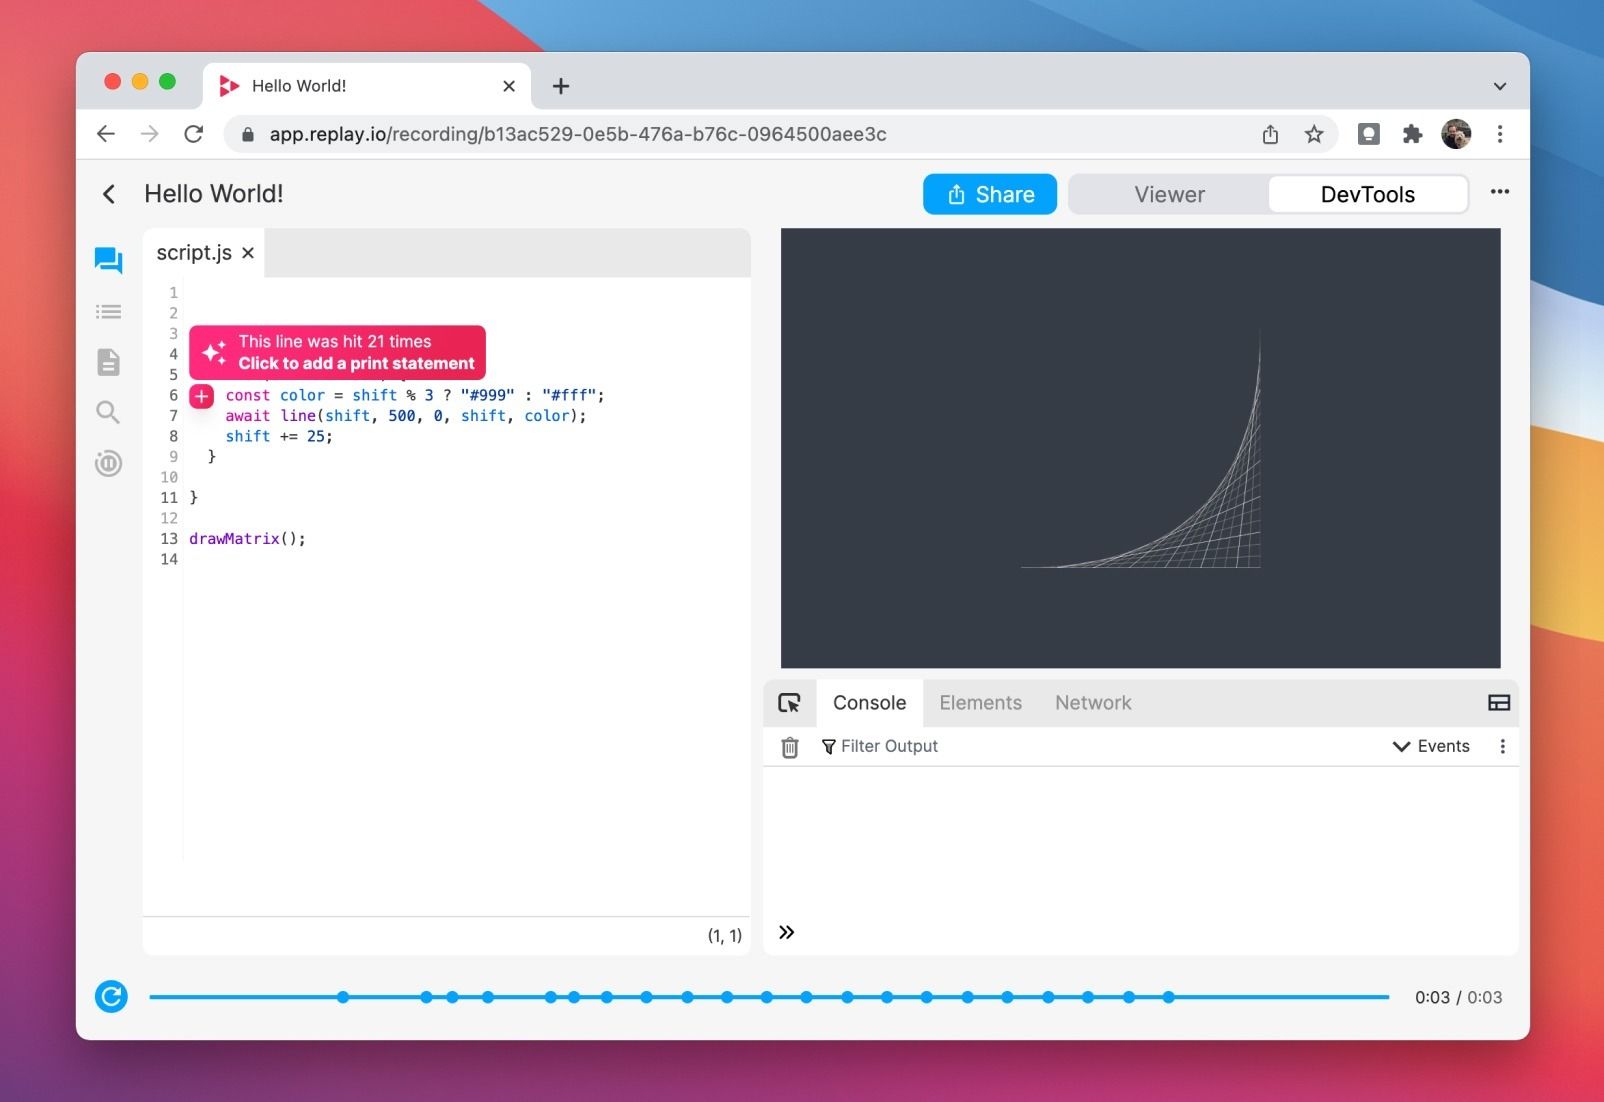
When we started, Replay was similar to other breakpoint-based debuggers. There was an option to add a print statement, but it was hidden behind a context menu. We knew that developers primarily debug with print statements and we had to shake it up!
That’s why we made breakpoints in Replay act like print statements. This worked reasonably well, but we still had to teach newcomers how to use breakpoints.
Today, we’re simplifying the flow with a new in-line action for adding print statements. This is one of those changes that seems obvious in hindsight, but is the result of months of iteration and learning.
As we reflect on the past twelve months, stories like these have been such a big part of our journey. When we started, few thought it would be possible to build a time travel debugger. And even if we pulled it off, few developers would prefer it to the print statement, refresh, reproduce loop.
2021 has been about re-imagining print statement debugging. It’s hard to put into words how special it has felt share the journey with all of you. We’ve done hundreds of user calls and learned something in each one of them.
As we look towards 2022, our new goal is to re-imagine collaborative debugging in a team, company, and community context. We look forward to sharing this journey with all of you!
P.S. In lieu of a formal case study, we just want to thank many of you for sharing replays with us recently! Peng, your bug in VS Code’s command palette really stood out because we modeled our palette after yours 😄
