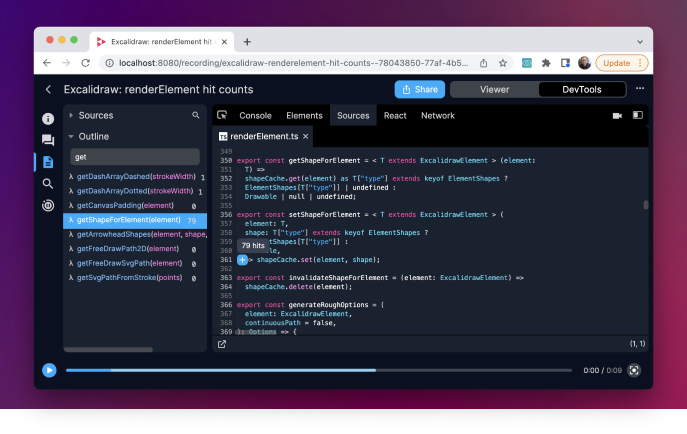
We’re excited to be shipping Heat Maps today! You can now open DevTools, select a source, and see function call counts in the outline view.
Heat Maps make debugging faster. When you hover in the editor, the Hit Count Tooltip appears immediately. The tooltip used to appear in 200ms, now it’s instant! The Outline View now shows function call counts which help you see which functions were called and spot inconsistencies.
Heat Maps can help identify dead code that can be safely removed and hot code that should be refactored. And like all of our backend functionality, Heat Maps are documented in our Protocol, so you can begin playing with it today!
At a high level, the value of Replay is the ability to perform dynamic analysis after the fact. Heat Maps are a small taste of what is to come.
Additional Updates
Multi Line Terminal You can now press shift-enter in the Console and Print Statement terminals to add additional lines.
Comments We removed many of the bugs that were causing Comments to flicker when you added them.
Focus Mode It is now possible to set the current pause position as the start or end of the focus window.
Redux Toolkit Mark (Redux maintainer) is refactoring our Redux setup to Redux Toolkit. Join our Discord Server if you’d like to help out.
Case Study
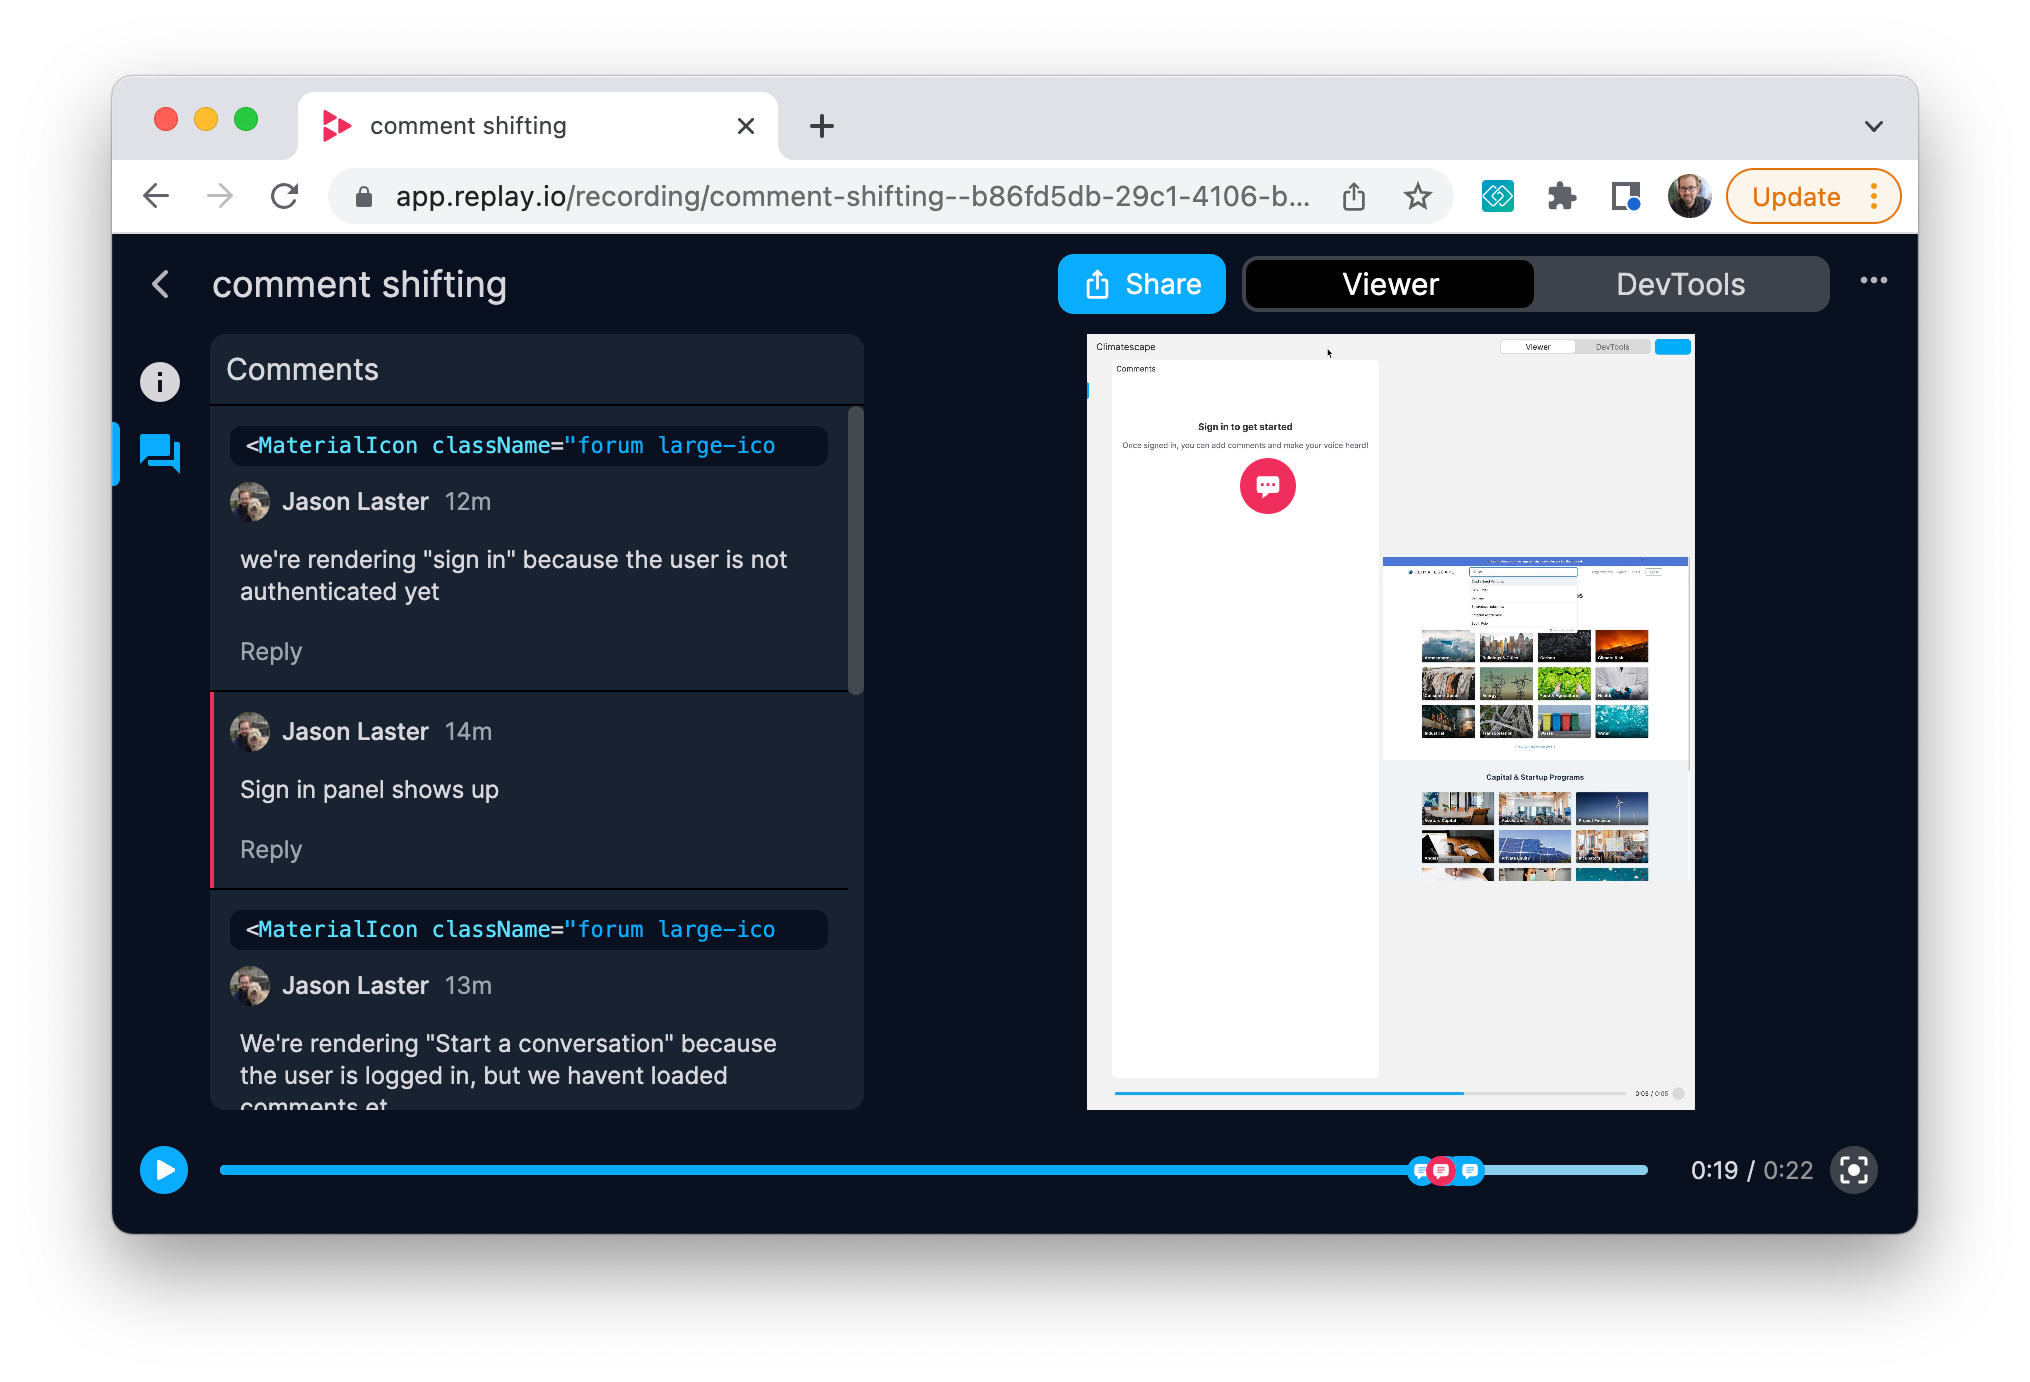
We thought it would be fun to highlight how Replay helped us debug several of the issues with Comments. This replay shows three issues:
- The Transcript prompts the user to Sign In while it’s waiting for authentication to load
- The Transcript prompts the user to add a comment while it’s waiting for comments to load
- The Comments is initially missing the content while waiting for the editor to load