We’re excited to welcome Mark Erikson and Brian Vaughn from Redux and React to the team and share our plans for framework debugging!
Here are some examples of what’s coming
- When you open Replay DevTools, you should see the Redux DevTools timeline and be able to jump to any dispatch and begin debugging.
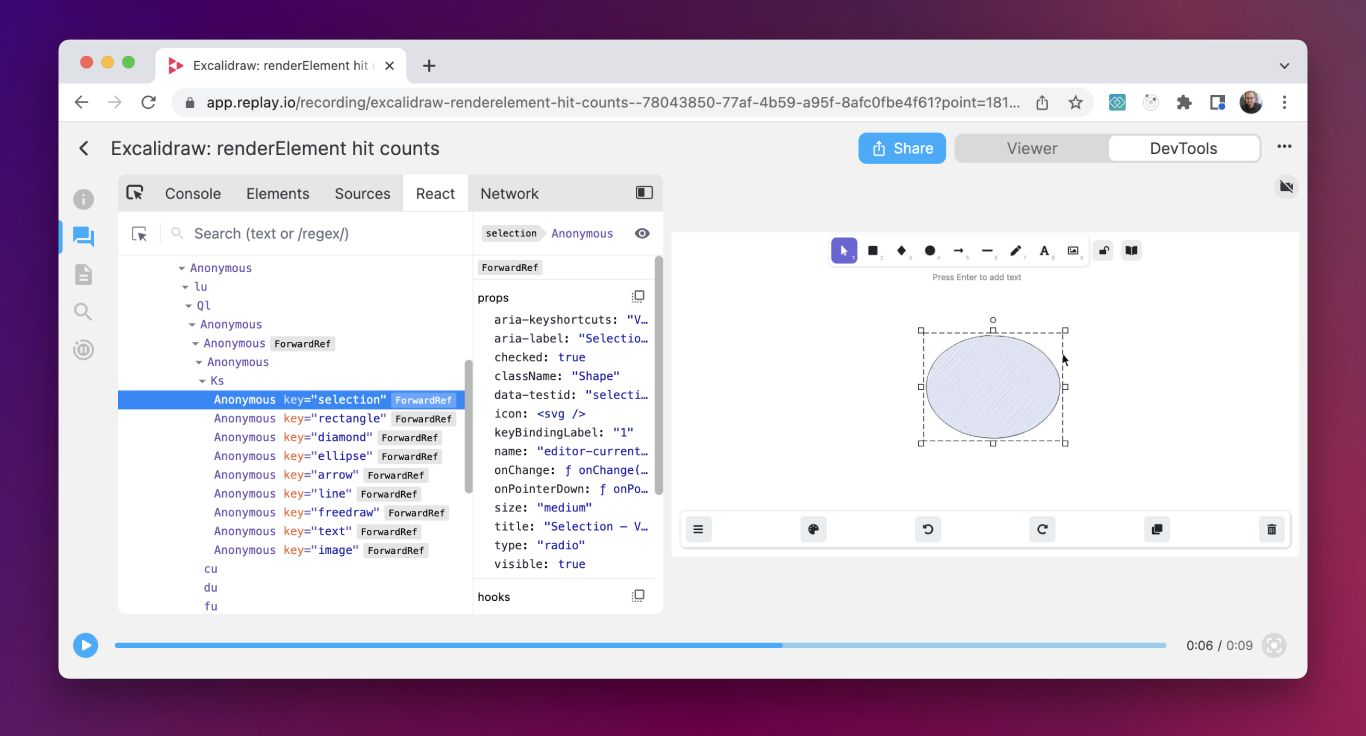
- When you inspect an element, you should see its React component, props, and state alongside its styles and attributes.
- When you pause in a component, you should be able to step into an ancestor component’s render in the same way you can step into a parent frame in the call stack.
We believe that the next step in framework debugging is enabled by time-travel debugging.
- Today, Redux DevTools visualizes the state of the store at each point in time. Tomorrow, time travel debugging will let you jump to a dispatch and begin debugging.
- Today, React DevTools shows the component tree. Tomorrow, time travel debugging will let you jump to a component render and begin debugging.
We are starting with React and Redux, but Replay DevTools is open source and we plan on adding more integrations in the near future.

Additional Updates
Recent crashes Last week we released a significant improvement to recording performance that caused a spike in crashes. The crash rate is back to normal and we appreciate your patience.
Source Maps in CI Playwright recordings in CI now include Source Maps.
Source Map Mappings We improved support for Vite generated source maps.
New Content
CI Improvements touches on some of the recent improvements we’ve made to recording tests.
Time Travel Debugging as a Service shares more context on how more DevTools can be built on top of Replay’s Time Travel Debugger.
How to Debug a Time Travel Debugger walks through how we diagnose and fix divergences in our Time Travel Debuggers.
Office Hours 👋
Join us on Fridays at 11am PT on Twitch at twitch.tv/replayio. We’ll be reviewing the recent features, our roadmap, answering questions, and live debugging with Replay.
Podcasts
Mark and Jason recently discussed Time Travel Debugging and OSS Bug Reporting with Ben Edelstein the Co-Founder of LogRocket. PodRocket

Case Study
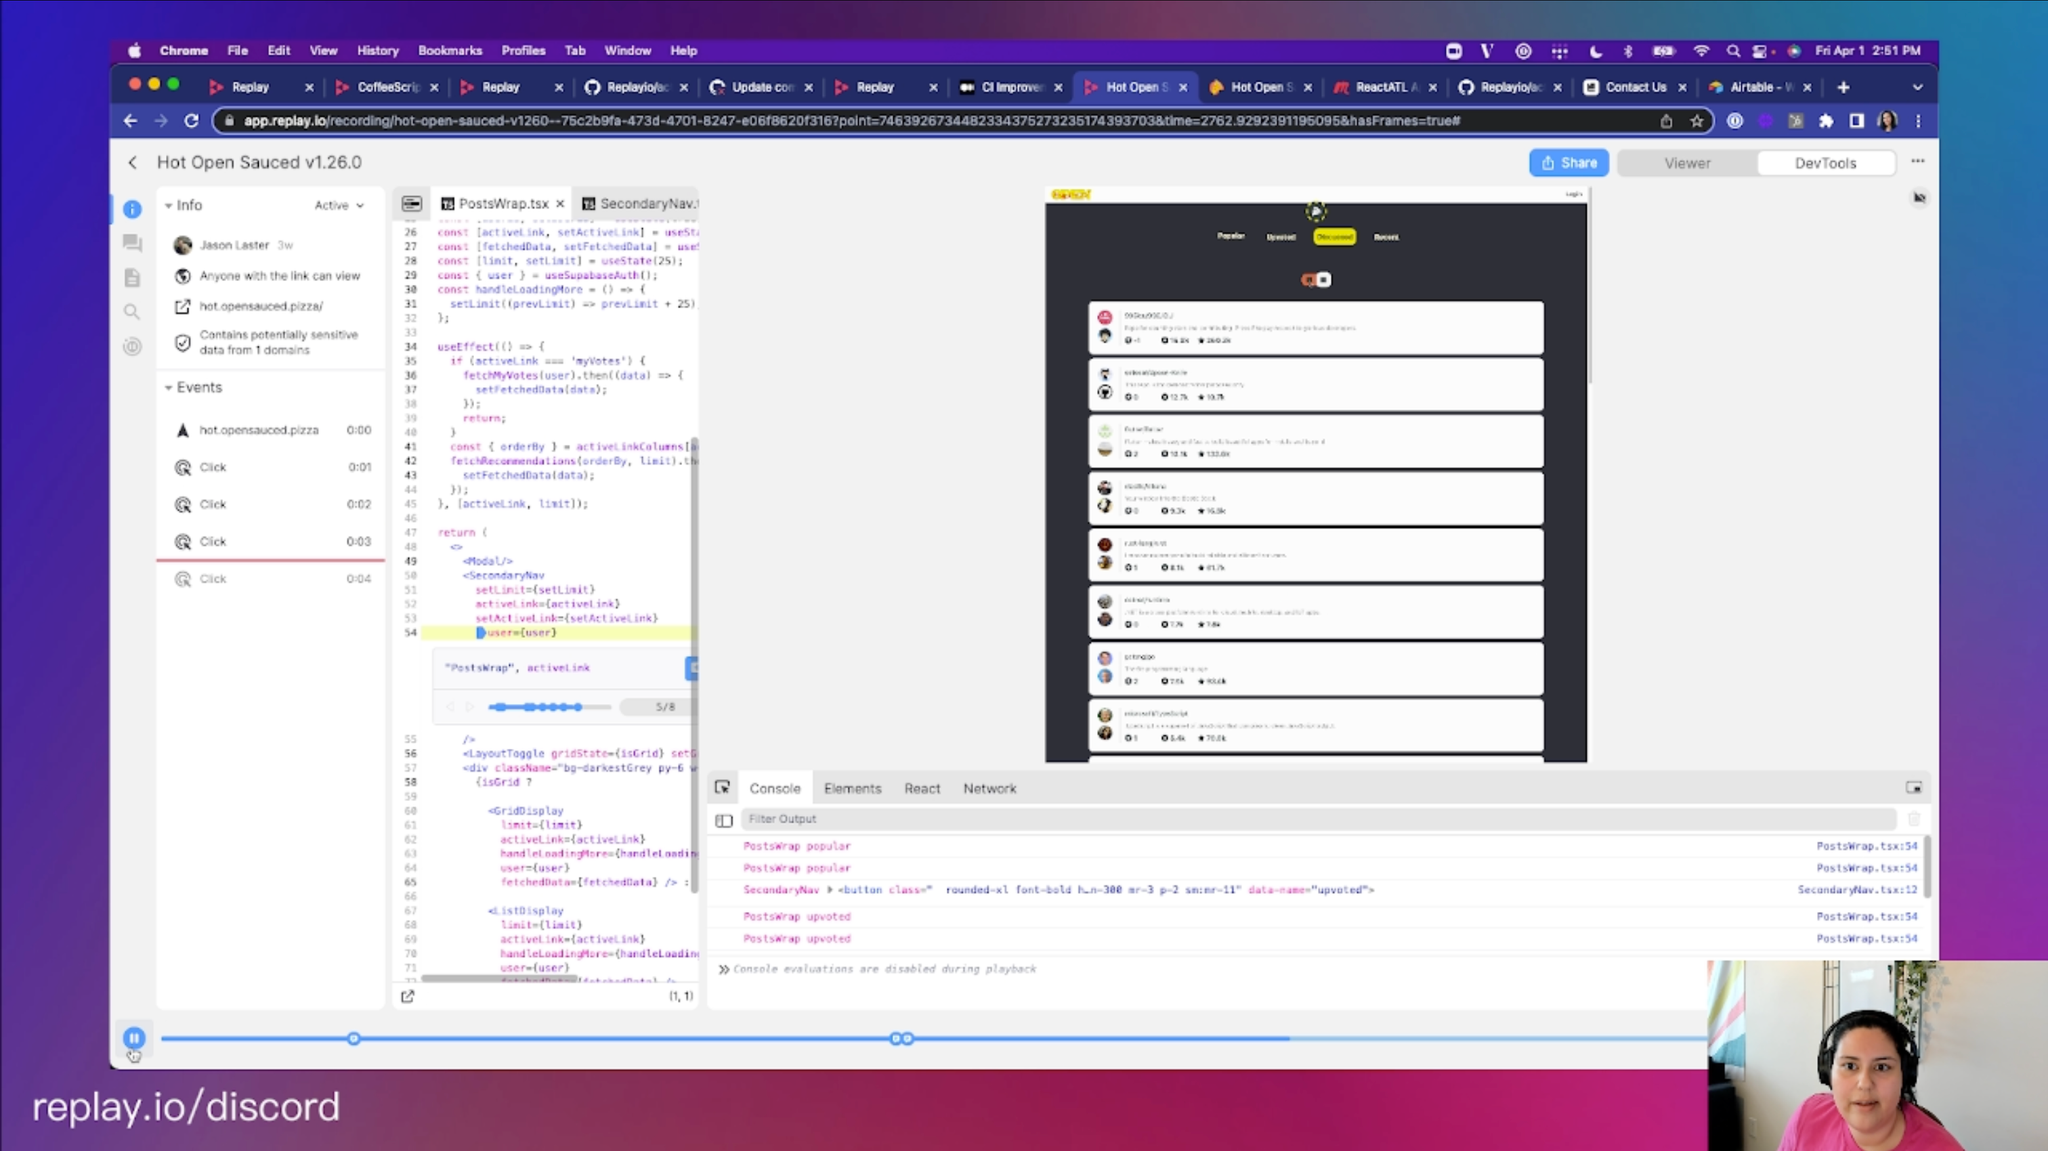
This week we’re excited to highlight Open Sauced, an amazing tool for getting started contributing to open source. Check out this tweet to see Cecelia’s deep dive into how Open Sauced is built 🤿 🐟 🍕

