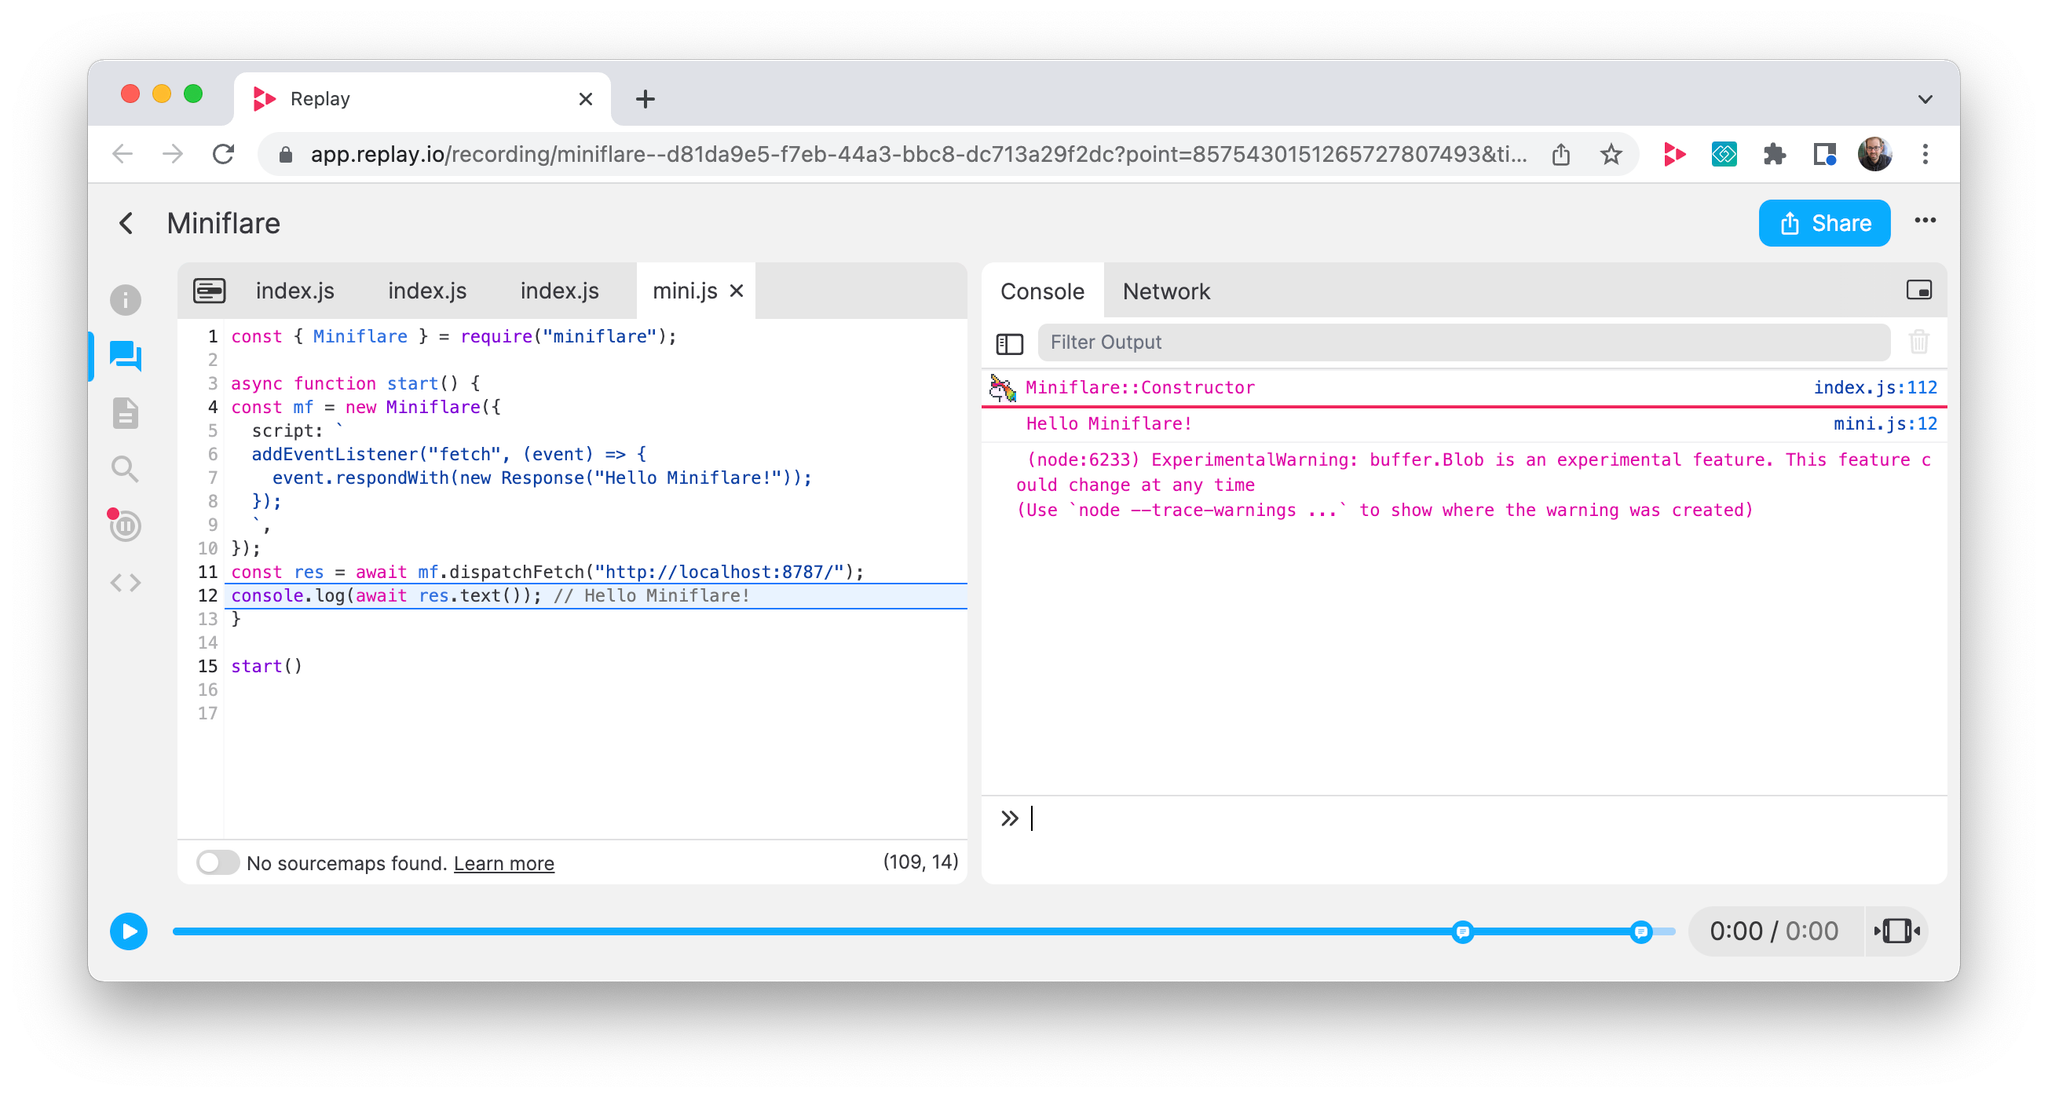
We’re excited to announce Turbo Replay! Turbo is our biggest release since Replay for Windows last November. Replays will start faster. Print Statements will evaluate faster. In short, Replay’s been turbo-charged 🚀
Before we jump into how Turbo works, we first have to share some context into how Replay works. When you’re viewing a replay, we’re replaying the runtime in our backend. Chrome is running as it normally does, except instead of talking to the OS, it’s talking with the recording.
We run replays on some of the most computationally intensive EC2 instances (100 cores, 1,000GBs of ram). Each recording runs in a Docker container that can use many threads and up to 50 GBs of ram.
In an ideal world, you would distribute the computation across many containers. The problem is that software execution is not easily split. This is where Turbo comes in!
Turbo lets us run recordings across multiple containers and distribute the compute across several EC2 instances. This leads to 3X faster Start times and significantly faster Print Statements.
We’d love to hear what you think. Let us know where Replay feels slow and we’ll fix it!
With Turbo shipping we thought it was a good time to share our vision for Replay’s Protocol. We often talk about how being able to replay addresses the problem of reproducibility, but the implications are far broader. (post)
Additional Updates
Node.js 16X
We rebased Replay Node onto v16.14 last week. Node is still in beta, so if you play with it, we’d love to hear what you think in Discord.

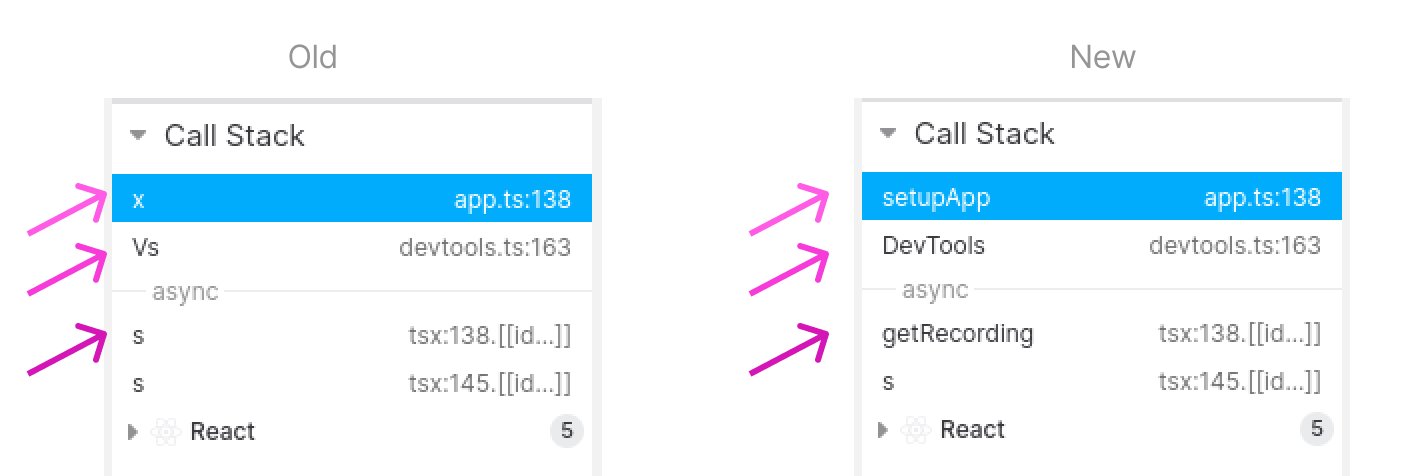
Original Call Stacks
Call Stacks now show the original function name if it exists. This is built on top of our scope and expression mapping which is light years ahead of Chrome and Firefox DevTools.

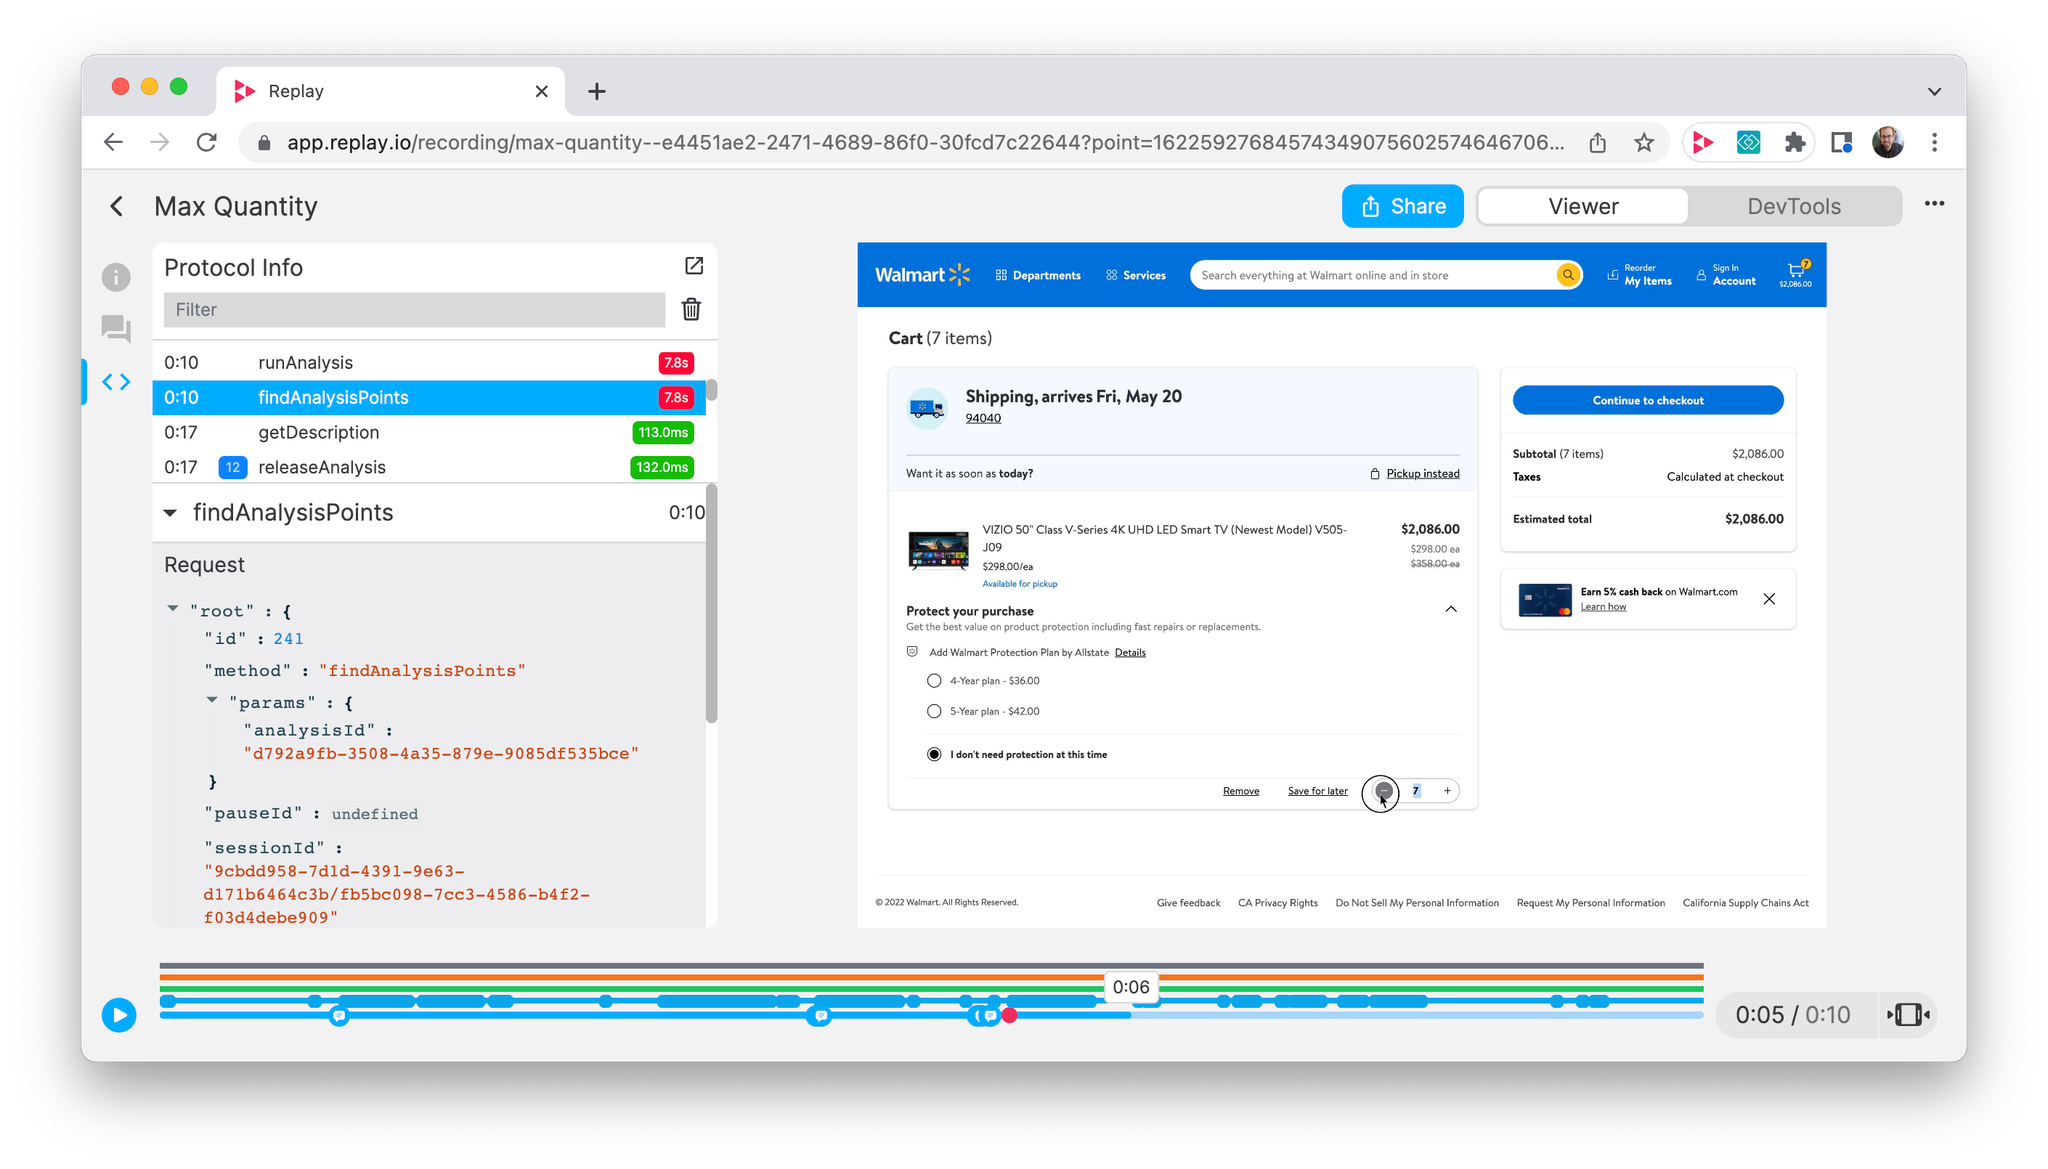
Protocol Viewer + Timeline
We shipped an internal protocol timeline and viewer last week to help us diagnose backend stability issues. If you’d like to learn more about how the protocol feel free to enable it by running
app.features.protocolTimeline = true and app.features.logProtocol = true in the browser Console.
Bug Fixes
Batch Sources Processing We are now batching source processing on the backend so that recordings with >70k generated sources and >400k total sources process significantly faster.
Console Overflows Focusing in the timeline will now re-fetch the console logs in the focus window allowing you to see previously overflowed logs.
Context Menus Yeison refactored our menus to use HeadlessUI and Popper so that they now have a consistent look and feel and keyboard accessibility. PR 🎉
Domain Allowlist It's now possible for organizations to set the list of allowed and blocked URLs from the team's settings modal.
