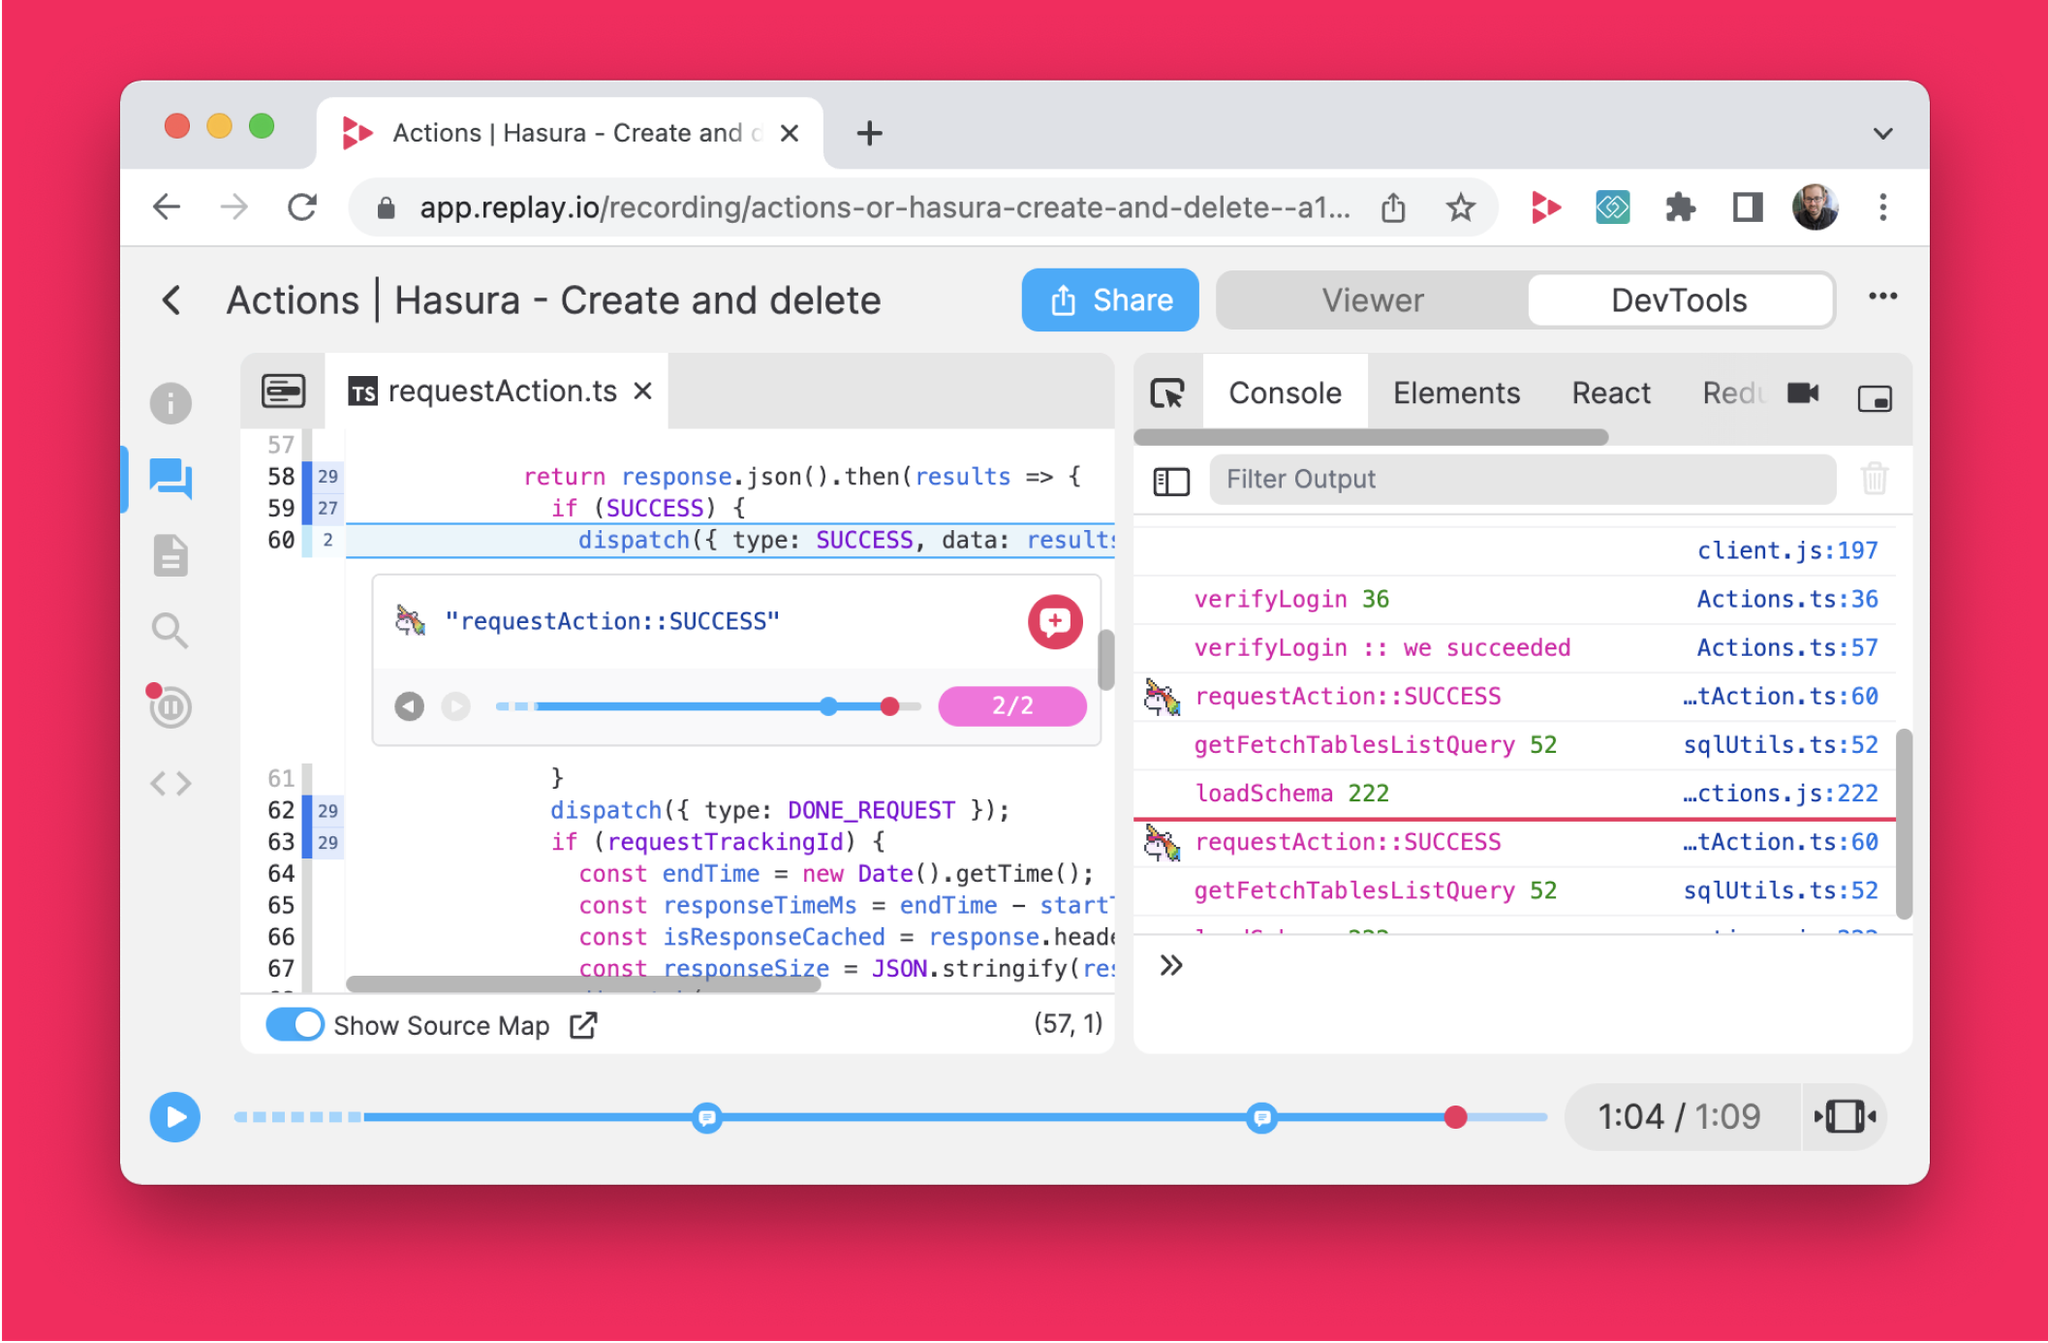
We’re shipping Heat Maps today. When you open a file, you’ll now see the Heat Map in the gutter.
Heat Maps are powered by the source Hit Counts API which we shipped two months ago. When they shipped, the Add Print Statement tooltip became instant, but we knew we could do more.
Heat Maps are that next step. Like the Unicorn Picker, they help you pick up on patterns that are not immediately obvious. For example, you might think that two lines were hit the same number of times, but when you see them colored differently, you realize something fishy might be up.
Heat Maps are the most visible change we have made to the editor since we’ve started. Let us know what you think!
New Object Inspector 🔍
As part of our architectural exploration, we decided to tackle re-writing our Object Inspector. The old inspector is 6 years old and shows it (1, 2). The new inspector uses new React APIs (Suspense Cache, Offscreen) and is far simpler, faster, and more testable (1, 2, 3).

Replaying Performance 🧈
A month ago, we started assigning debugging sessions a Butter Score. Every session starts with 100 points, and we subtract points for what we consider bad user experiences, e.g. fatal crashes, slow starts and slow requests
In the past two weeks, we’ve improved the median time from 30 to 70. Let us know where replaying feels slow for you and we will improve it.
Additional Updates 🔍
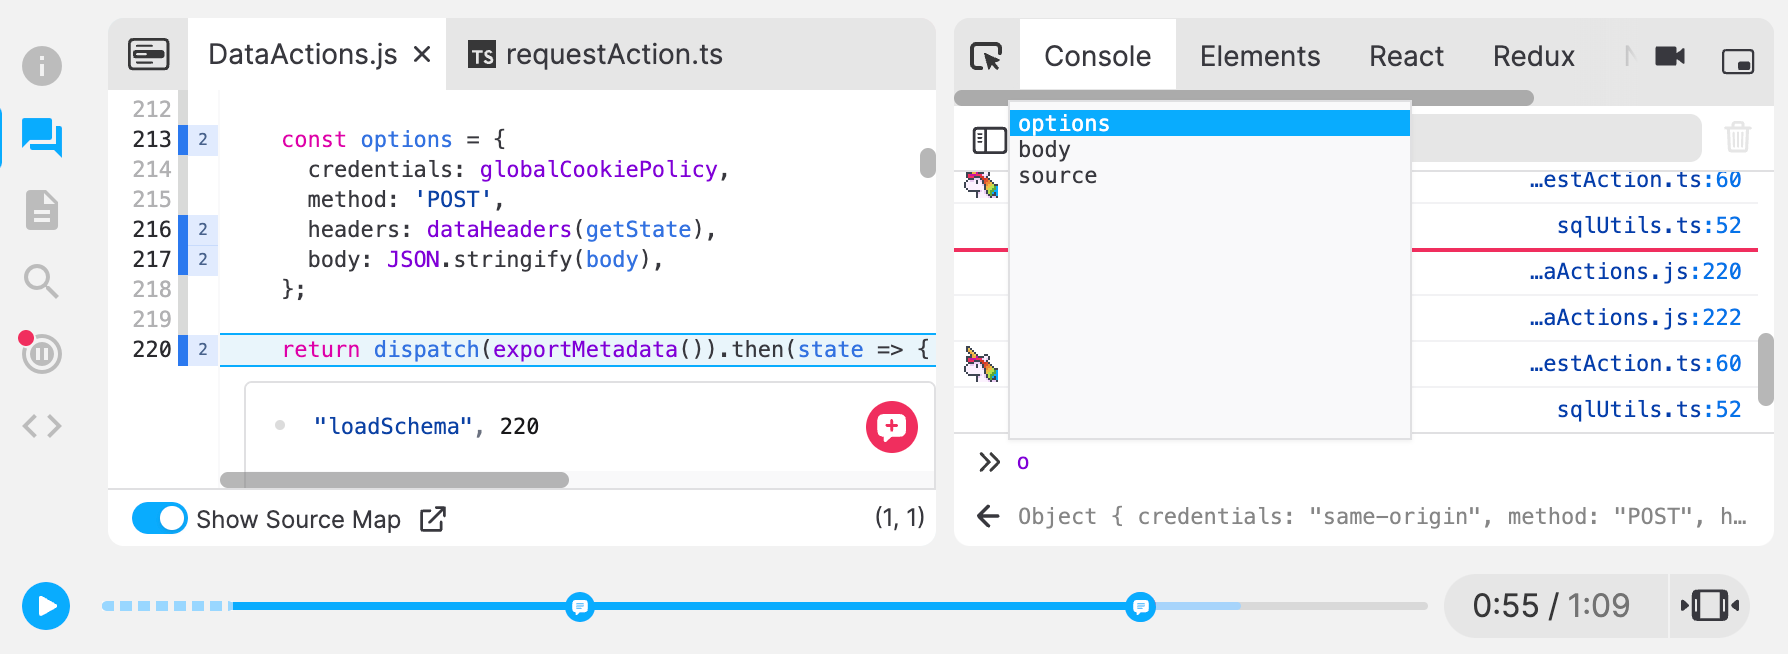
Autocomplete The Console’s autocomplete type-ahead list is now virtualized which is far faster and smoother (Loom).

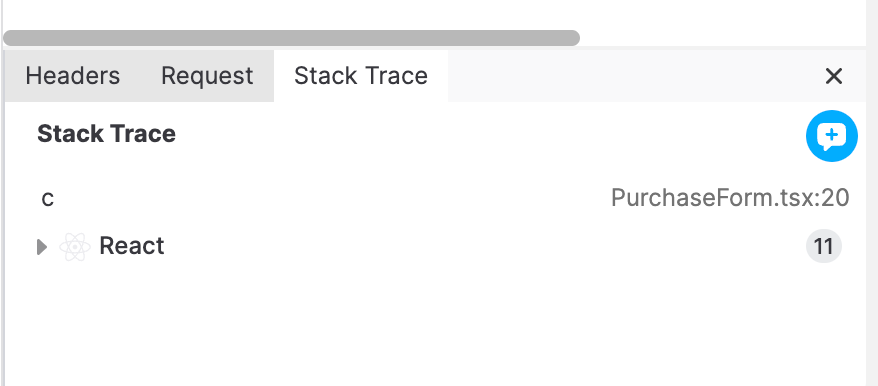
Network Monitor Stack traces are now grouped by framework which make it easier to see where the request was kicked off.

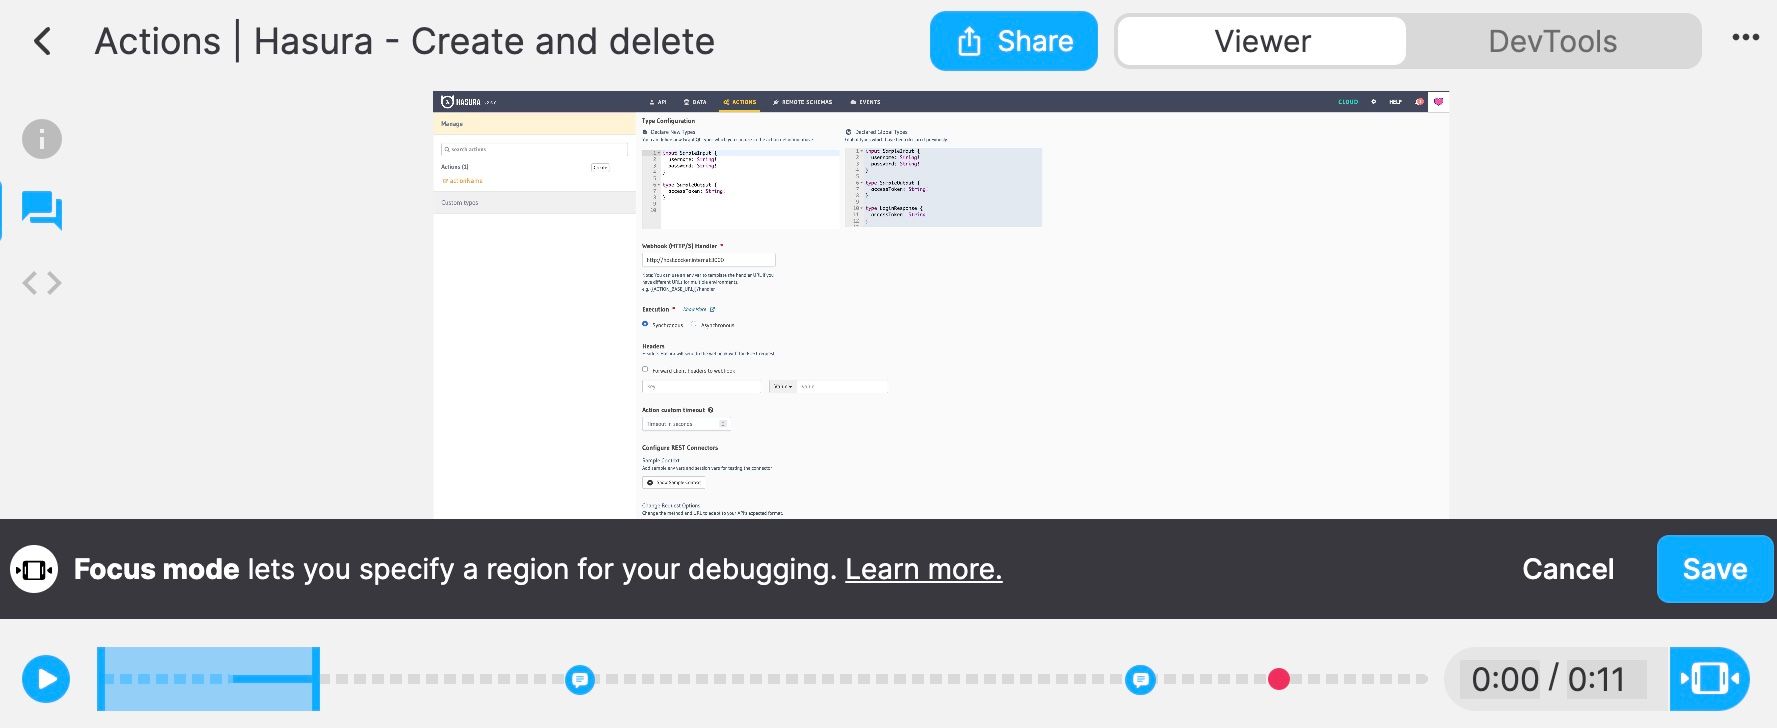
Focus Window It is now possible to load regions that were previously unloaded by the server

