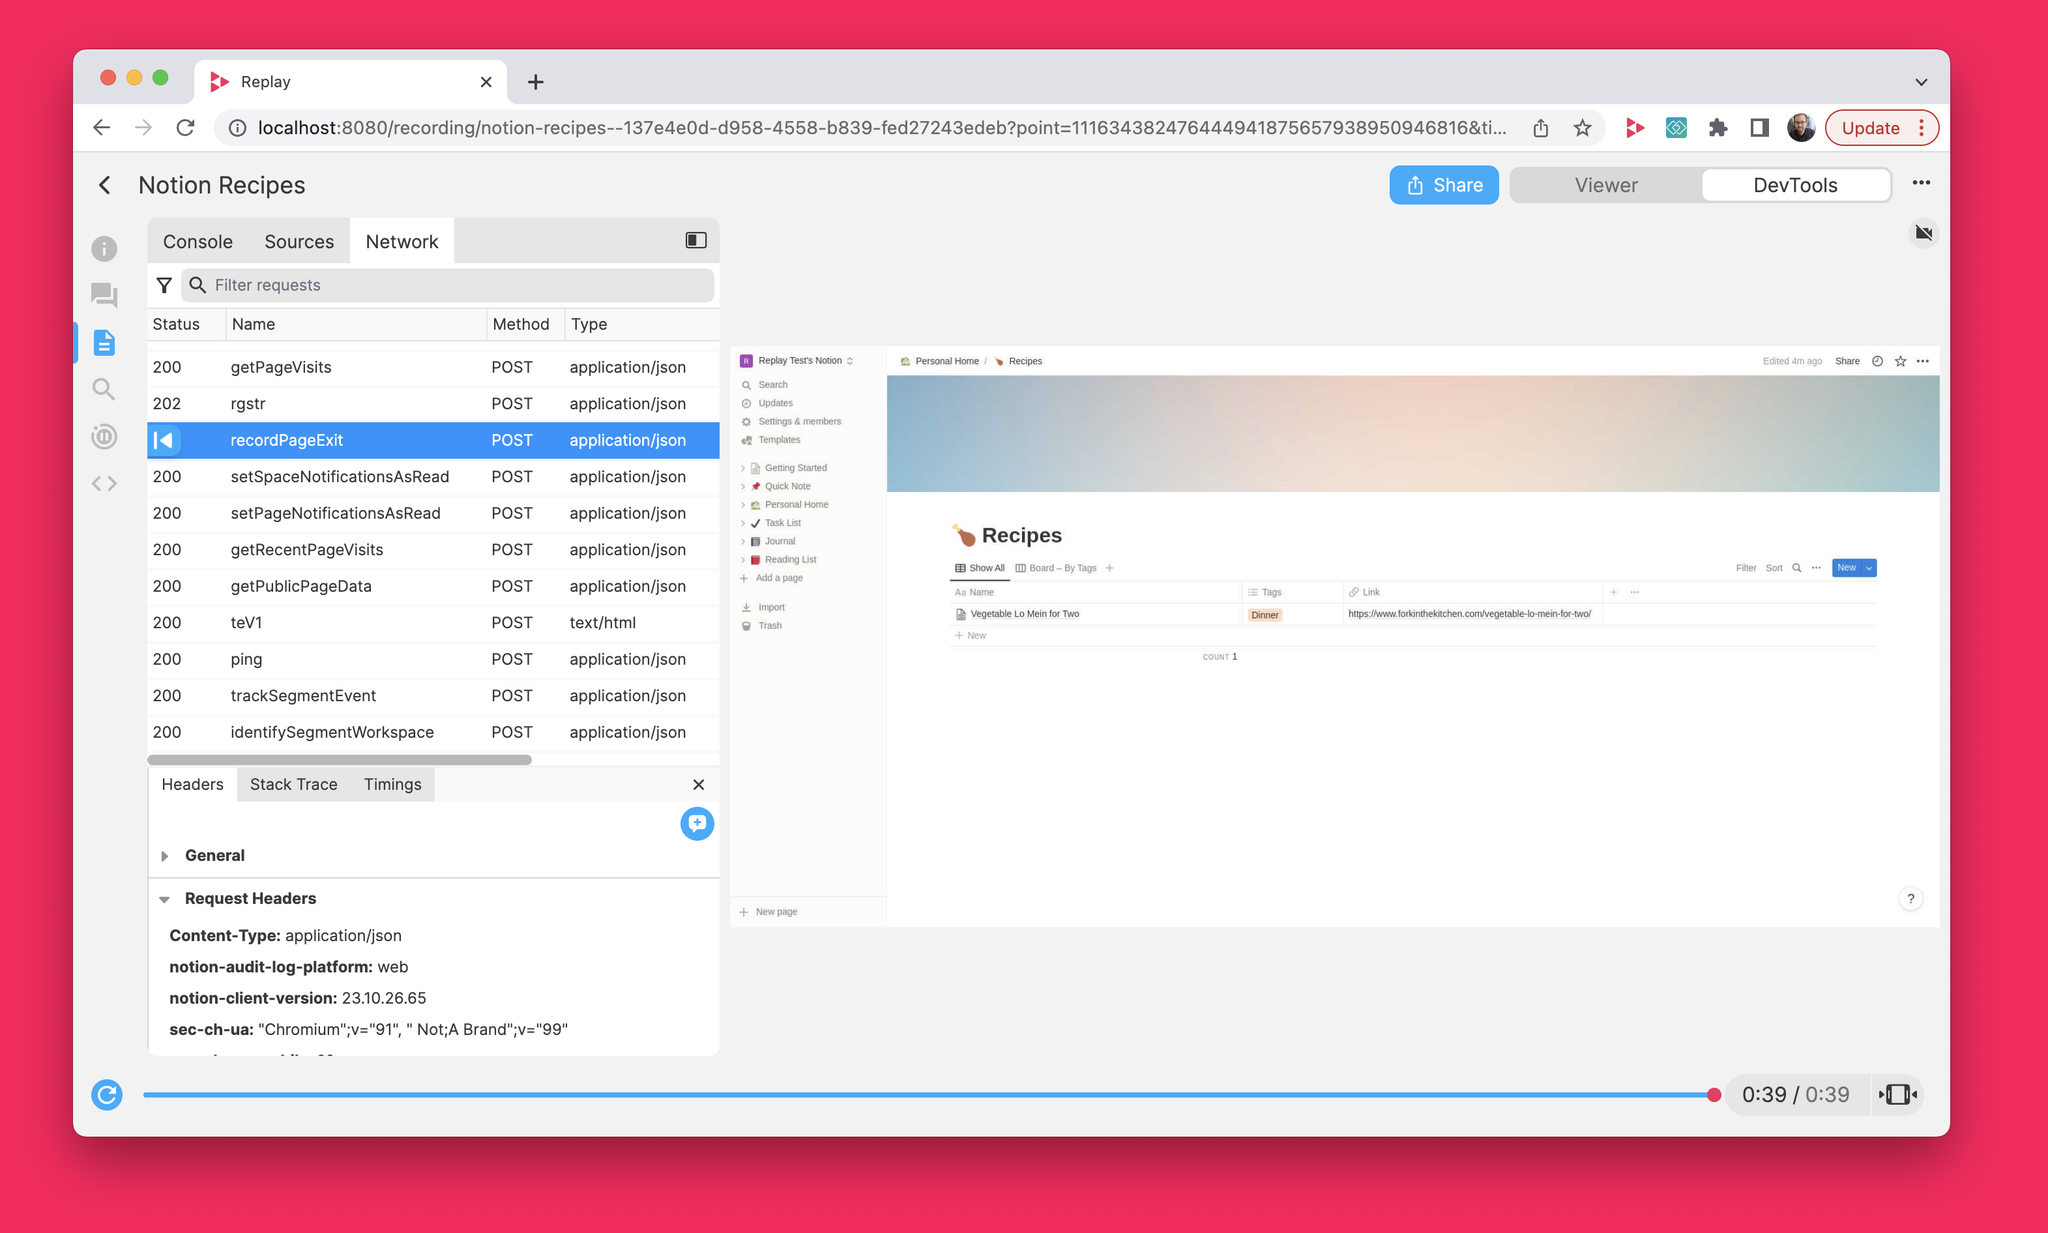
After two months of heads down development, we’re thrilled to be shipping the Network Monitor for Chromium. The next time you open a chromium replay, you’ll see the Network Monitor next to the Console!
We’re also excited to share that recording chromium replays has gotten a lot faster over the past month as well. Our median recording overhead is now 27%, but we won’t stop until we are consistently below 20%.
Chromium is a pre-requisite for being able to record and replay Playwright and Cypress tests. We'll share more soon!
Runtimes as a DB 🚀

When somebody records a replay and shares it with you, you should be able to open it and begin debugging immediately.
The fundamental challenge is that compute is approximately linear. Replaying a two minute recording takes approximately two minutes. Turbo Replay helped us distribute the compute, but not remove it.
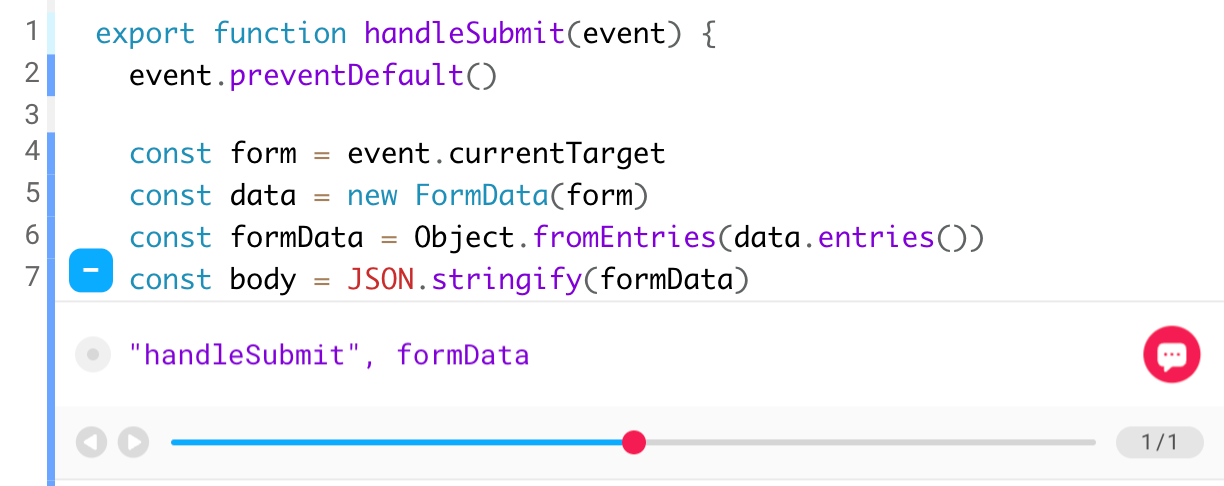
This week we’re kicking off project “runtime as a db” which will let us store our in-memory execution index so that viewing a saved replay does not require any new compute. If successful, we think you’ll be able to open a replay, find a source, and a print statement in under ten seconds!
A new source viewer 🔎

We’ve always assumed Replay DevTools would be built on top of a text editor like CodeMirror or Monaco. It seemed crazy that we’d build a debugger where you could add breakpoints, step, and preview variables and not use a text editor.
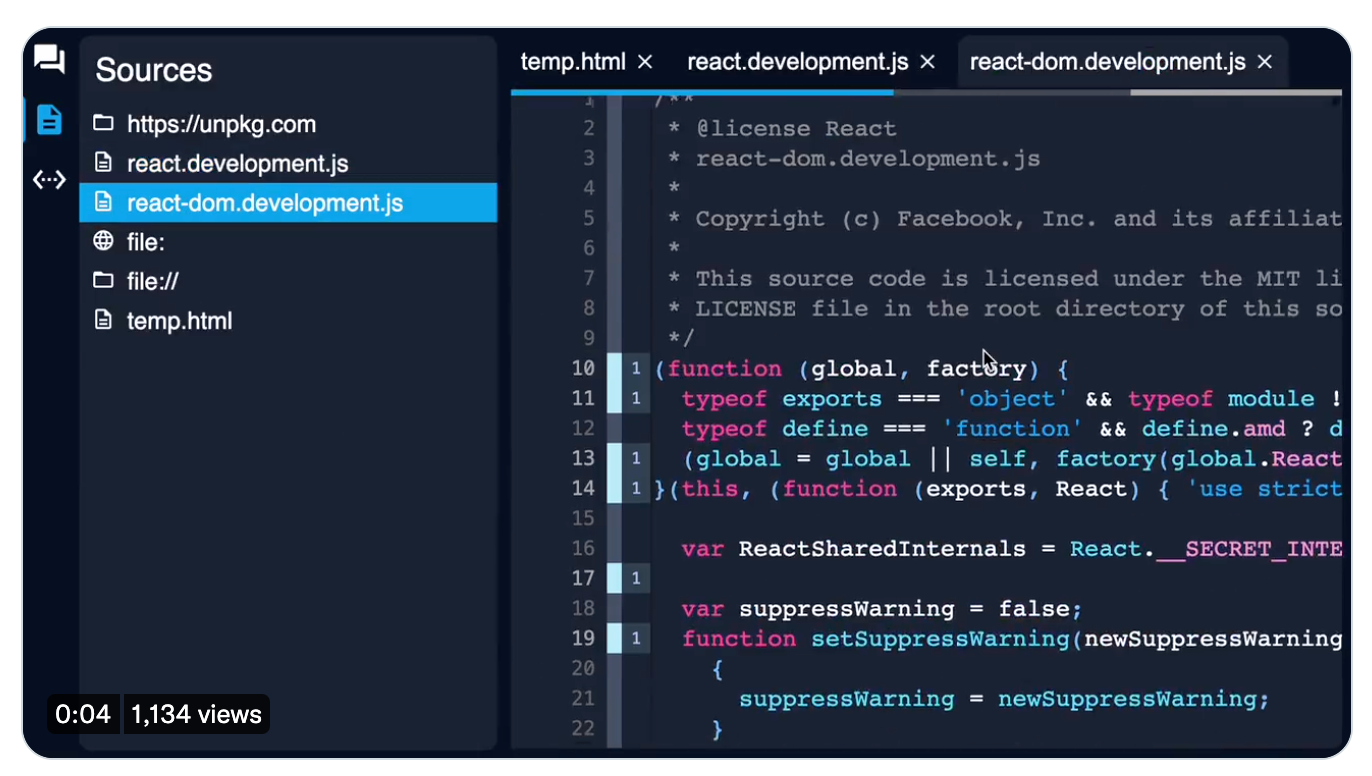
Today, we’re excited to share that we’ve found a way to drop CodeMirror in favor of a simple React component built on top of React Window and Lezer’s incremental parser.
We'll share more about how it's built soon, but the important thing is that the new source viewer already feels far better than the old CodeMirror version. If you'd like to play with it, go to settings > experimental > new source viewer and let us know what you think!
