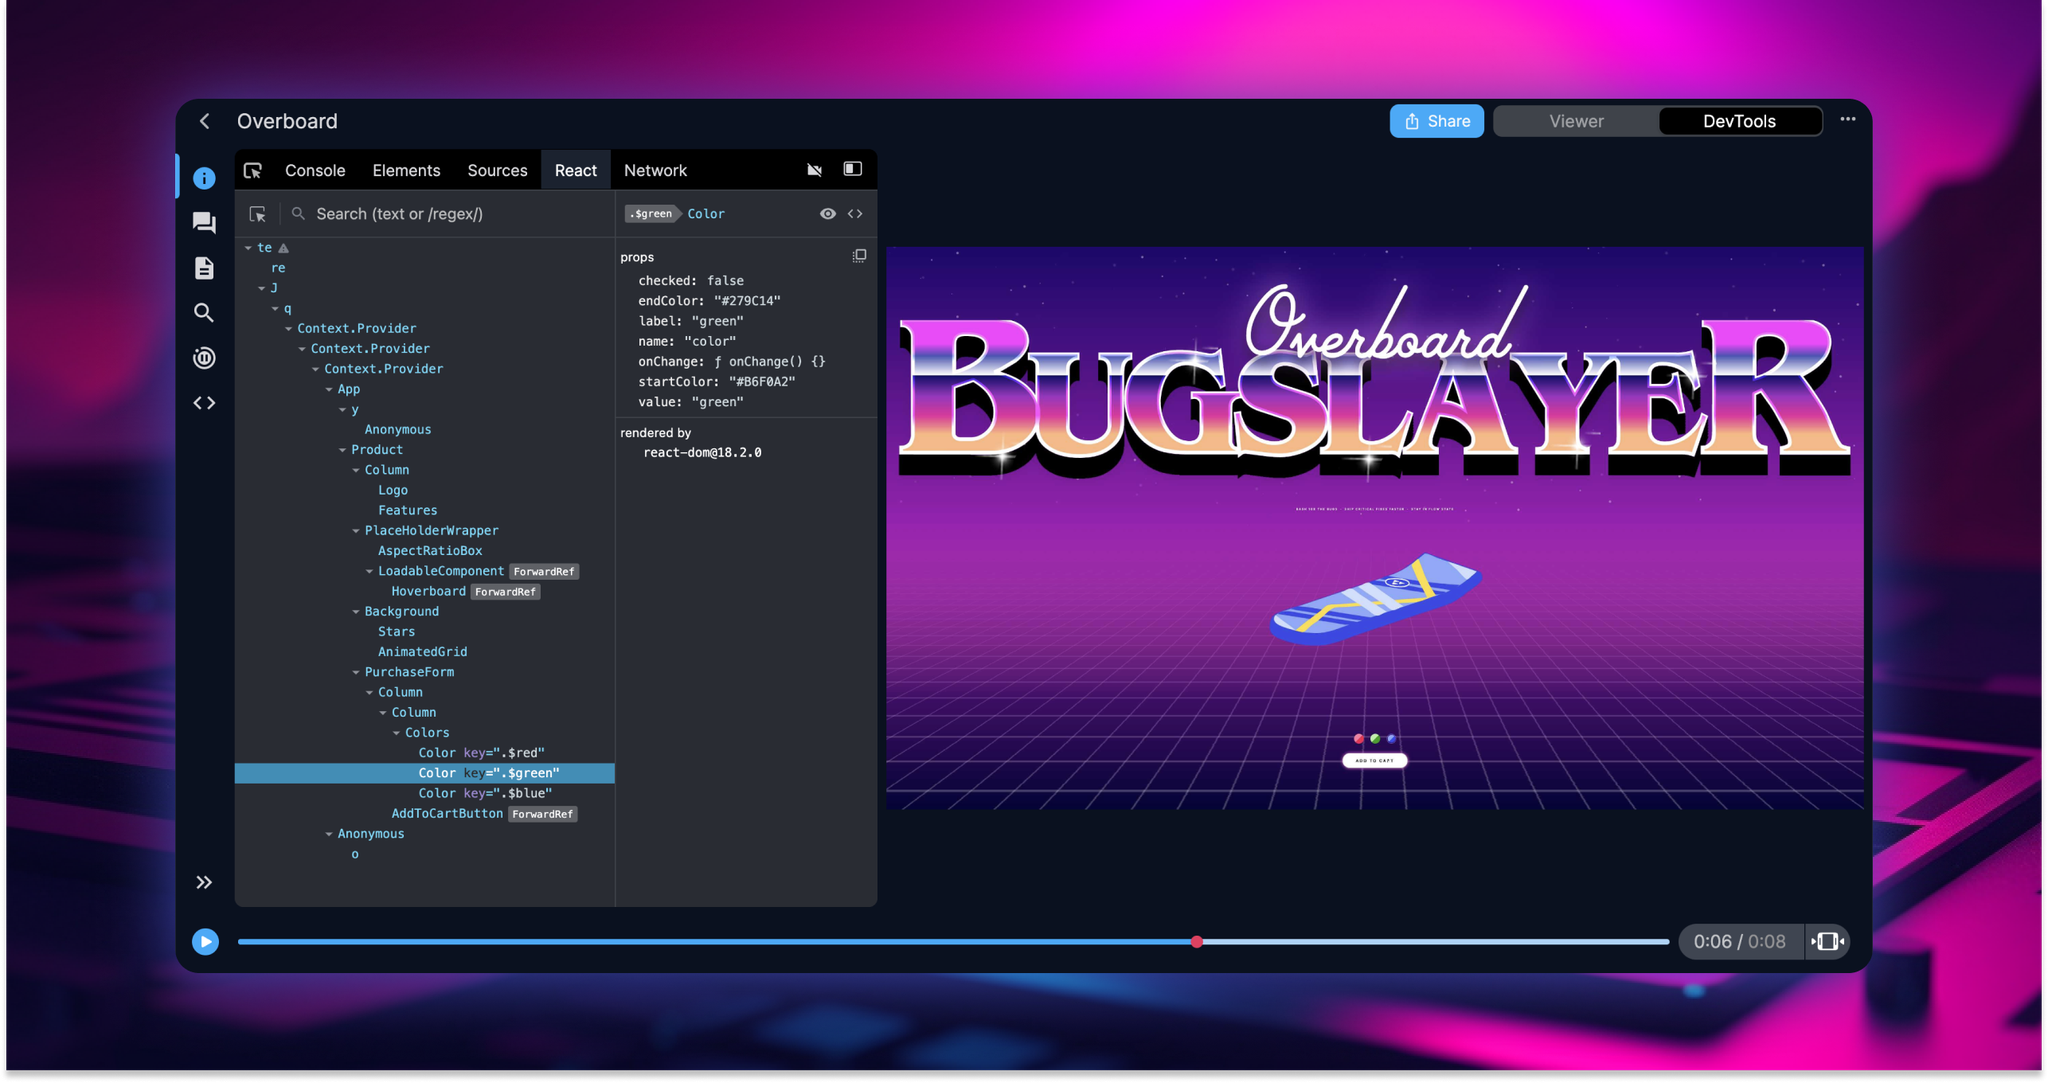
We’re excited to release Original React component names for Chrome. When you open a replay that’s recorded with Chrome and view the React DevTools panel, the component names will be mapped.
This is a big deal because you’ll now be able to record a replay in any environment, inspect your application, and see the original component in React DevTools. This is an improvement over standard React DevTools, where you only see the original component names in development.

We are able to map the component names because we run React DevTools’s backend when we replay the recording where we have access to our Scope Mapping APIs. This is a big deal for us personally because it’s the first non-performance benefit of running a script at replay time vs record time.
Our goal is to build the React debugging environment from the future. Let us know what you’d like to see next!
A New Dimension
Tune in next week for our biggest release since we launched Replay DevTools in 2021. Time travel will never be the same.

Instant Replay
Last week’s Incremental Snapshots release slashed our P50 debugging start times. At this point, instant starts is a matter of optimization and engineering, not crazy R&D.

Chrome for Linux
Last week, we reduced our Chrome for Linux recorder’s overhead by 4X. With this improvement, recording a replay capable of time travel is now as fast as recording a session replay of the DOM.
We hope to cut our overhead in half again. This is incredible because you’d think that recording the browser would be far slower than recording the DOM, but in reality it's the opposite.
The thing to remember is that diffing the DOM is really intense, but our method of intercepting system calls is very light-weight.

