


We’re excited to share that Replay’s recorder is now 54% faster. Recording a replay is now faster than recording a video and comparable to recording a session replay.
If you're wondering if we planned a 54% perf improvement to celebrate changelog 54. Nope, we just care a lot about performance and the gods have a sense of humor 😂
Last month we reduced our recording overhead by 8X. Like all optimizations, the first cut is always the easiest. Half of the speed up came from realizing we were downloading the same source map multiple times. Yes! Source map networking overhead was the biggest bottleneck. The second half came from re-enabling two features we had disabled in Chrome V8’s Garbage Collector and JIT.
Today’s 54% improvement came from optimizing two internal functions. The first was the
EventsDisallowed which checks if an event is triggered by a user visible action like a Promise microtask or an invisible action like a Garbage Collector sweep. The second was optimizing our progressCounter function which is used assign an execution point to every JS statement in the trace.The unique advantage of replay systems is that you don’t need to record the application state, video, React component tree, network requests, or console logs while the application is running. You can recompute everything at replay time. This means that we can make the recorder invisible and provide a debugging experience that’s better than local development.
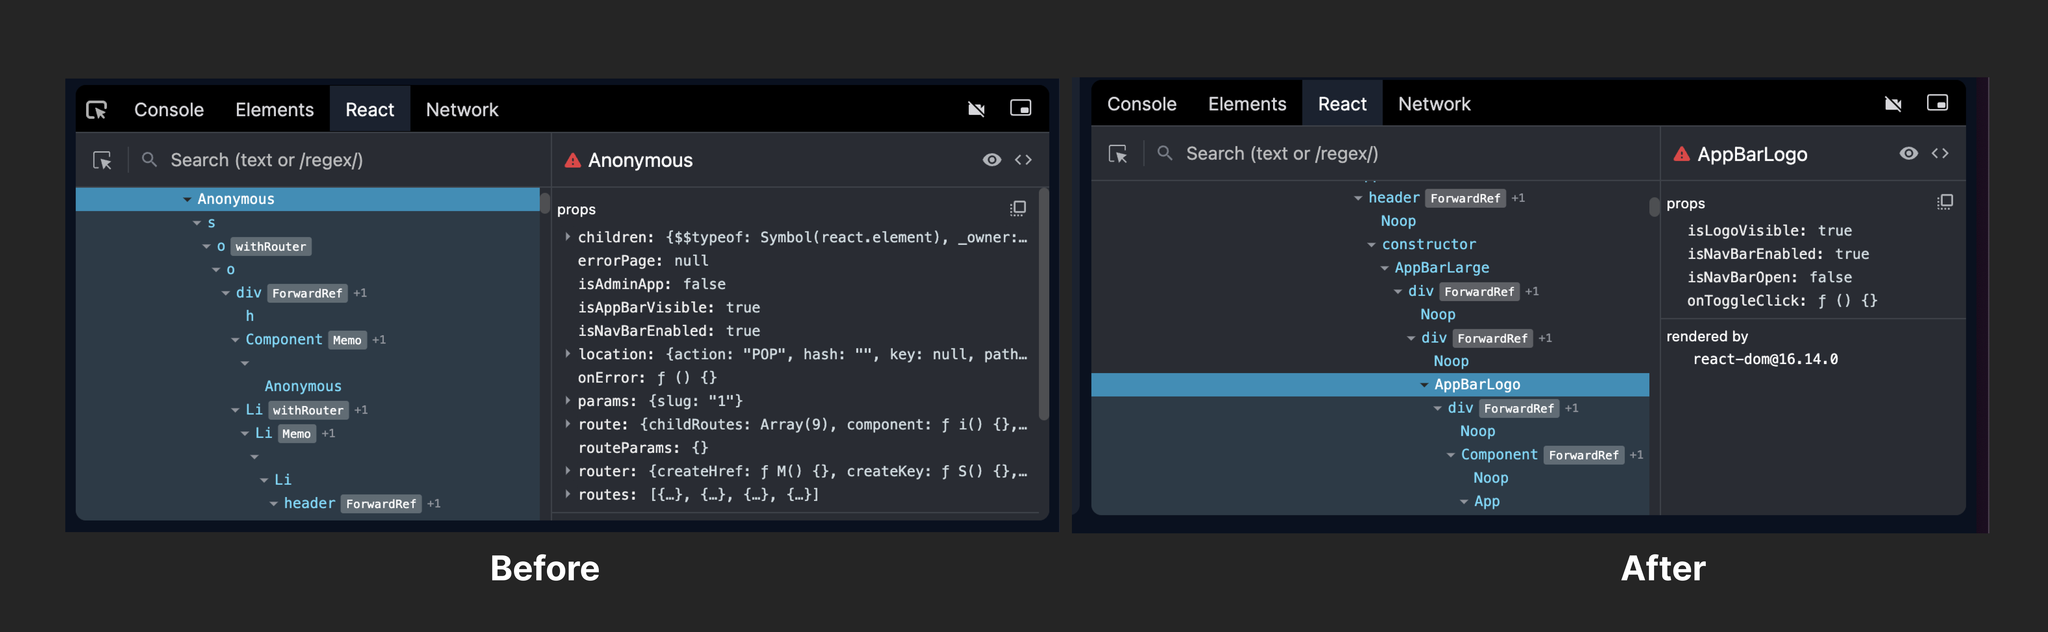
React DevTools
Last month we released original component names where for the first time React DevTools would use source maps to show the original component names in the tree. Since then we’ve extended it to support React primitives such as context providers and Suspense.
Using source maps to reverse engineer the original names is the kind of optimization that would be prohibitively slow to do while the application is running and is only possible at replay time.
We’re just getting started exploring what’s possible. Two weeks ago, Mark shared a tweet of an early proof-of-concept Redux profiler that’s built on top of the debugging protocol and not only shows the slowest dispatches, but the time spent in the reducers, subscribers, and selectors. And of course, because you’re in a time machine, you can fast forward and rewind to any call.

Cypress DevTools
We’ve improved our built-in support for Cypress retries so that it is easier to see which tests ran multiple times and compare passing and failing runs.
The best part is that because tests are built into Replay’s focus window, it’s easy to see which functions ran for each test and compare their timings. The video below shows a flaky test that we found this week where when the test failed, the user was signed out too early.
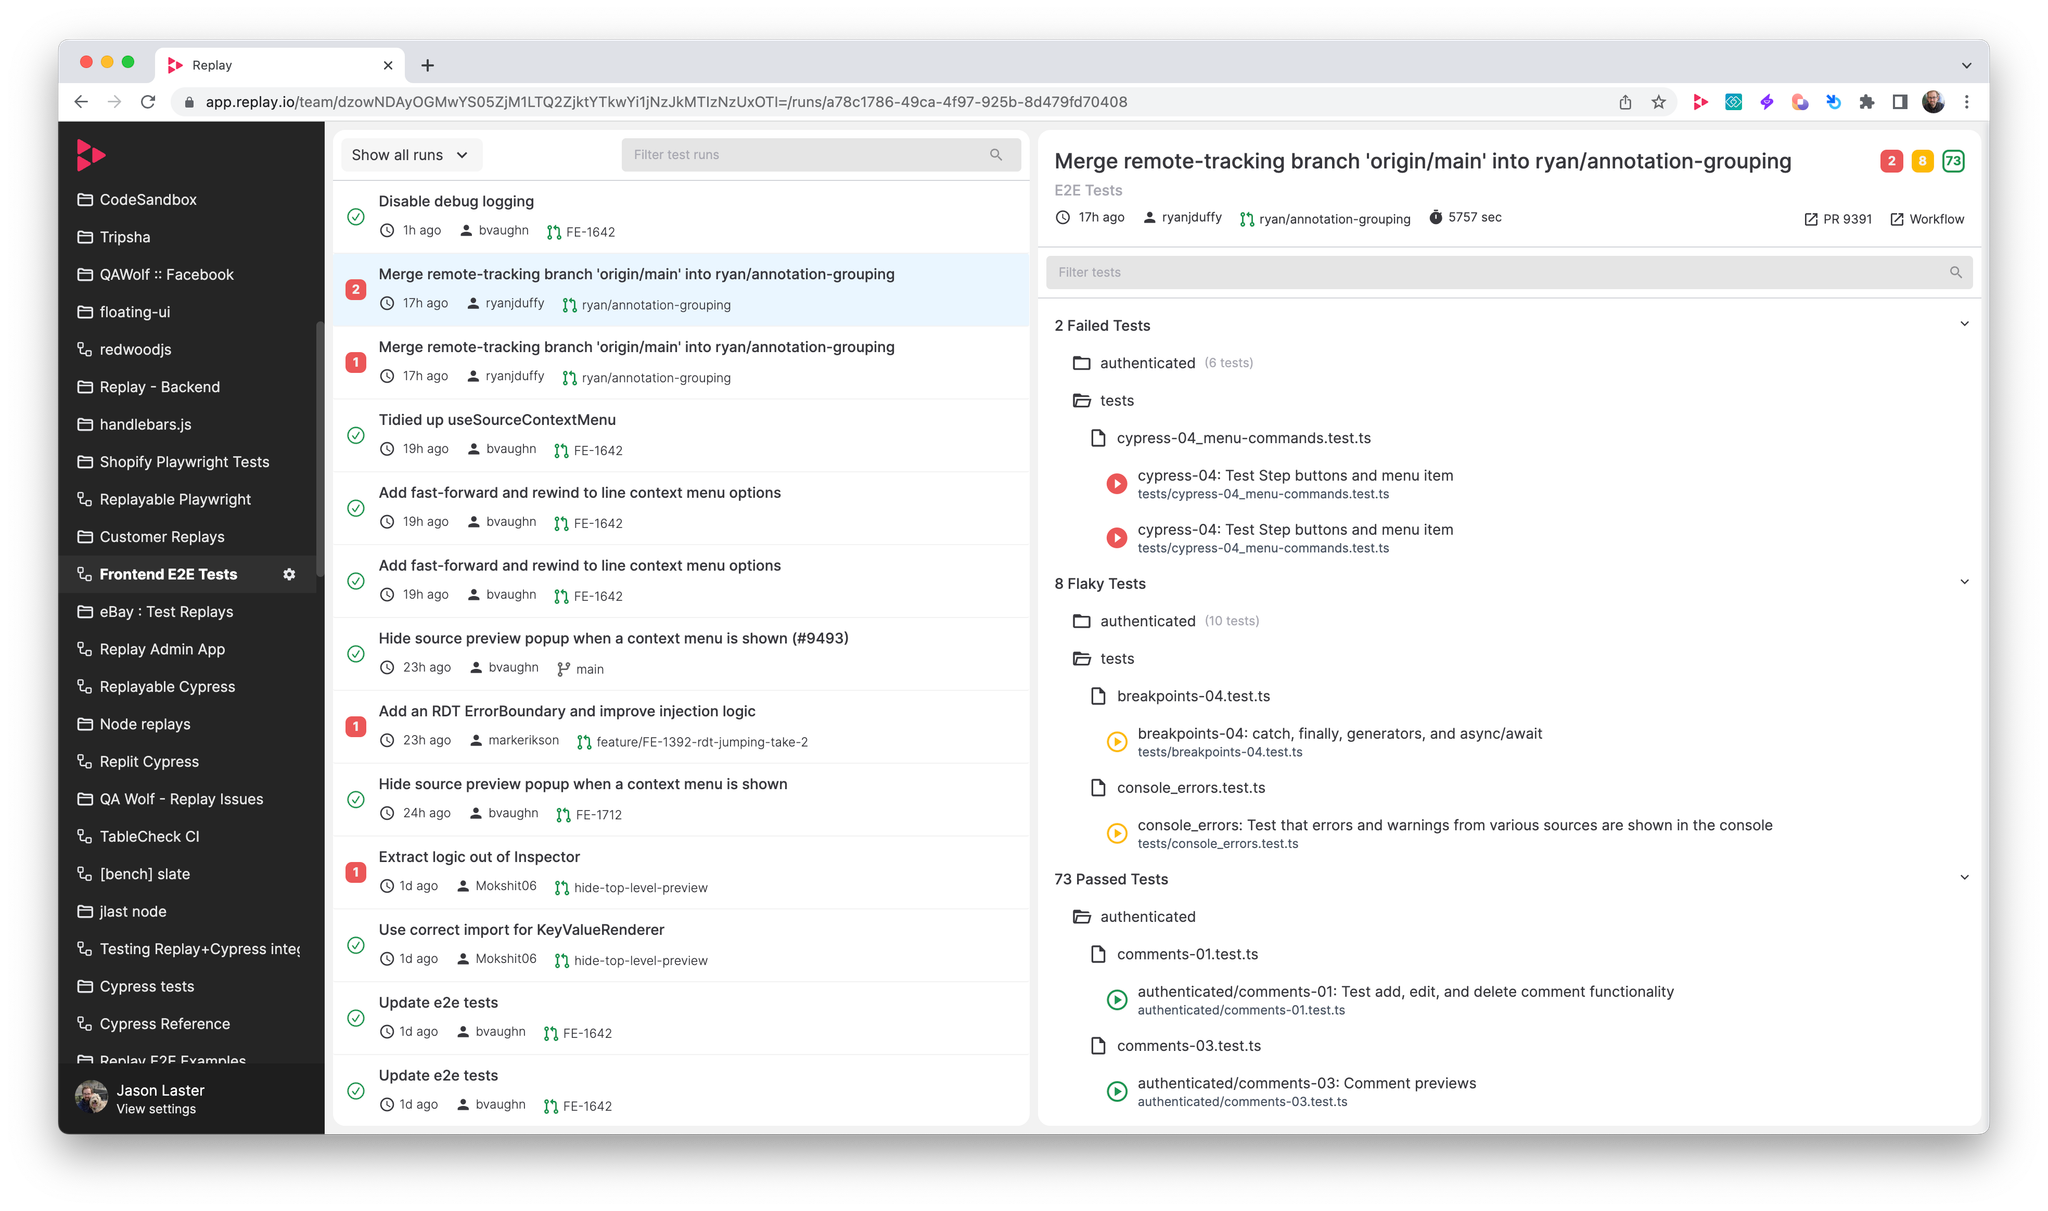
Test suite dashboard
We’ve also updated our test suite dashboard so that it’s easier to filter by test run and title and visualize flaky tests over time.
Additional updates
- Instant Replay has helped us show Console logs and source hit counts significantly faster. Previously it could take us a minute to build the process tree. Now we can build in half the time and no longer need to block on it. (9375)
- The source viewer context menu now has a rewind and fast forward to line option. (9492)
- Re-opening the source search (cmd+f) input now selects all text by default (9453)
- Object inspector getter values are now consistently rendered (9446)
- Selecting a function in the quick open modal now scrolls to the function (9476)
- Our left-hand nav icons got a usability refresh (9393)
- Navigating back to the dashboard will remember the team (9484)