

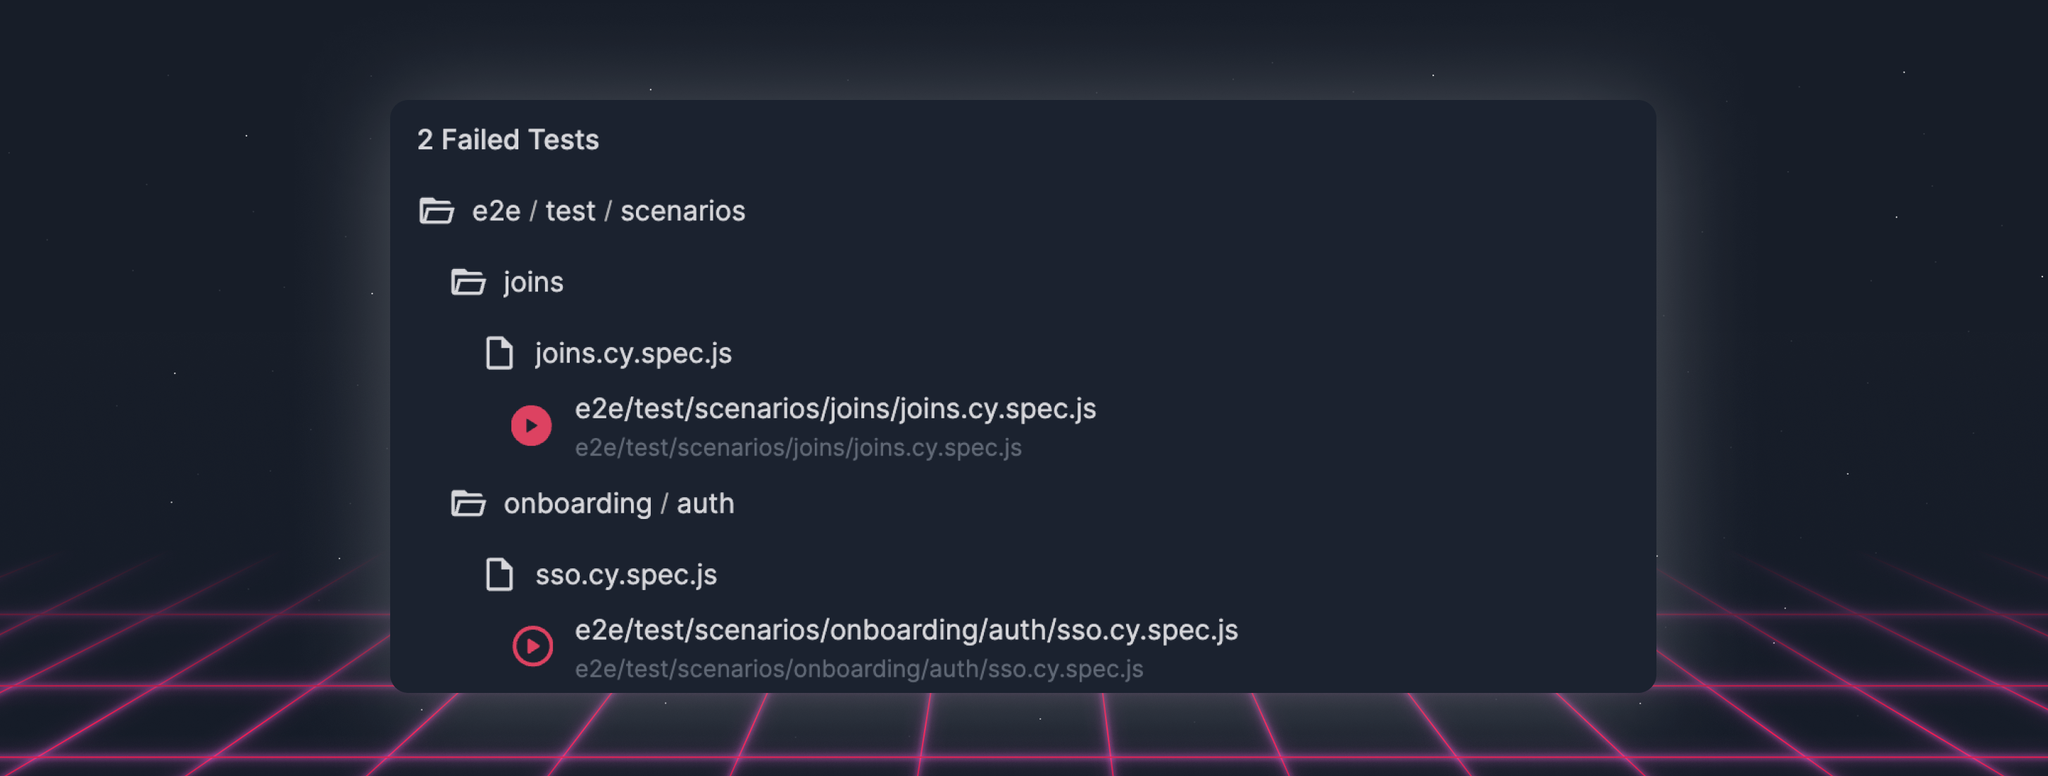
Today we’re shipping a big little detail, the processing badge. The next time you open the Test Suite dashboard you’ll see which replays have been processed. And when you open a replay that’s not been processed, you’ll see that we’re first processing it.
We process replays so that they start quickly. At a high-level, processing is simple. We replay the recording once and create the video, collect network requests, console logs, hit counts, and take snapshots every 3 seconds.
The reason we do not process every recording in the CI use case is that if you currently spend 100K on your AWS CI compute bill, replaying every recording would double your bill. And realistically, you do not need to debug every test failure. Typically, you only need to look at a couple of replays of a flake to find the root cause.
Processing will play a bigger role going forward. We’re beginning to explore automating the flake analysis to find the most common sources of flakes: steps that ran at different times, orphaned elements, react components that rendered differently. Because we’re actually replaying the browser, it’s fairly easy to automate many of the first steps that we all do when we look at a test failure and surface those findings in the Dashboard.
React DevTools Reliability
Two weeks ago we added assertions in our React DevTools backend that made it stricter. That meant that if at any commit the DevTools did not have the correct component tree, we would prevent showing React DevTools.
This helped us uphold the first rule of DevTools (never lie to the user), but meant for many users React DevTools became unavailable. We’re rolling out improvements today and next week that should bring the availability back up and we apologize for the down time.
More Correct Node Picker
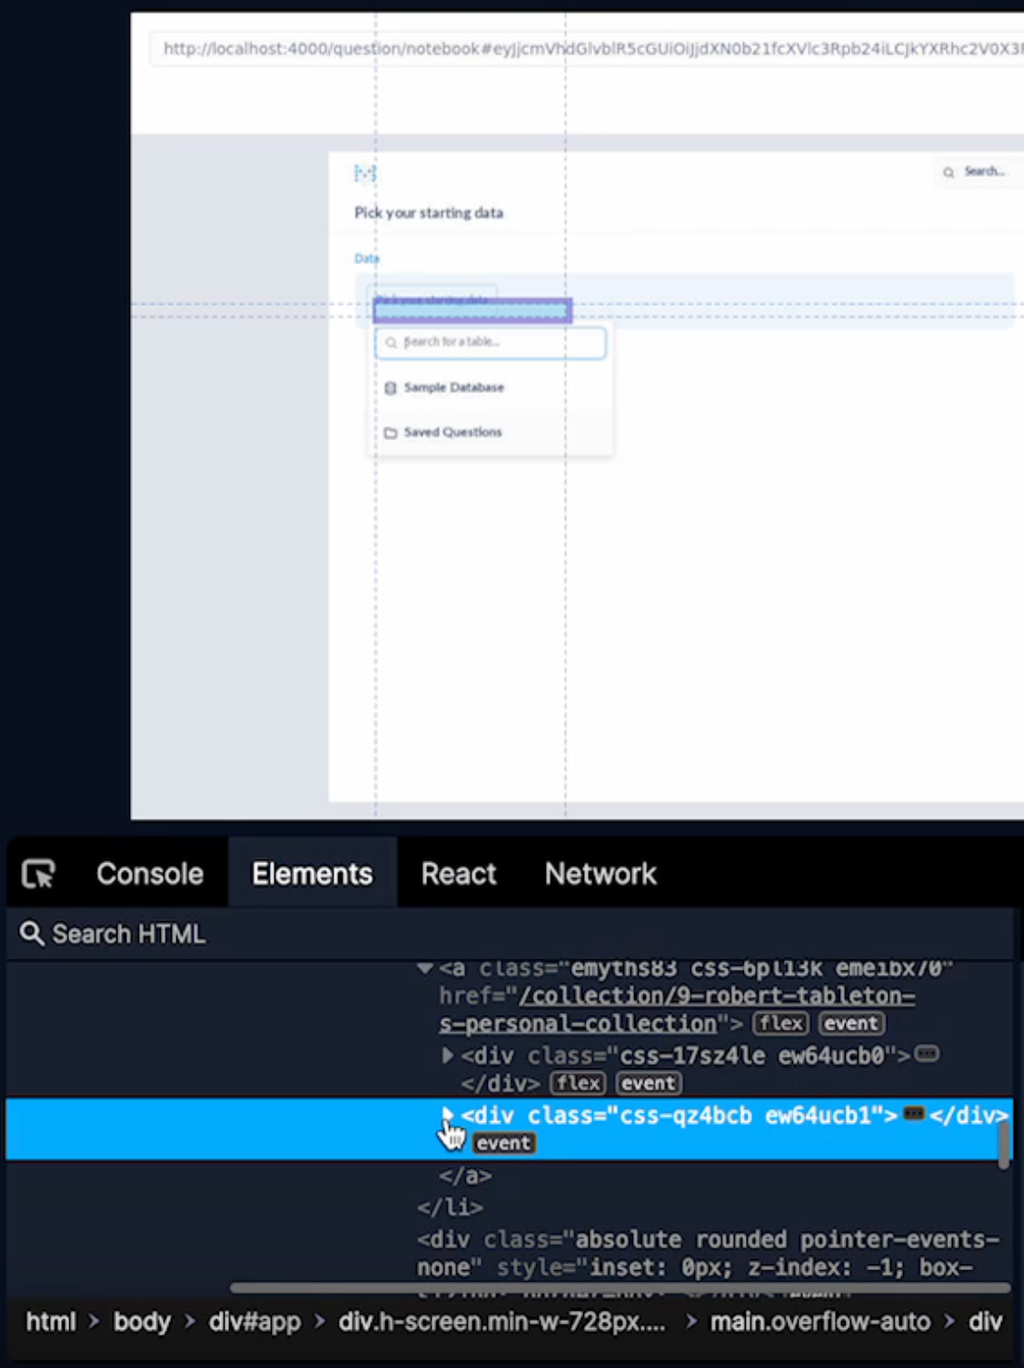
We started stress testing our Chrome Node Picker this week and found cases where the stacking context which identifies which element is on top was incorrect.
You can check out the StackingContext algorithm here, the PR here, and the automated stress test here. The stress test is particularly clever 😉
Faster print statement panels
We identified two cases where the print statement panel could take awhile to open. When both of those cases occurred at the same time, it could take up to ten seconds.
Before
After
There were also several minor quality of life improvements:
- Fixing edge case where the focus window didn’t update correctly ()
- Fixing jump-to-source for alternate source locations ()
- Adding loading progress bars to the Network panel ()
- Fixing popup preview for instance properties ()