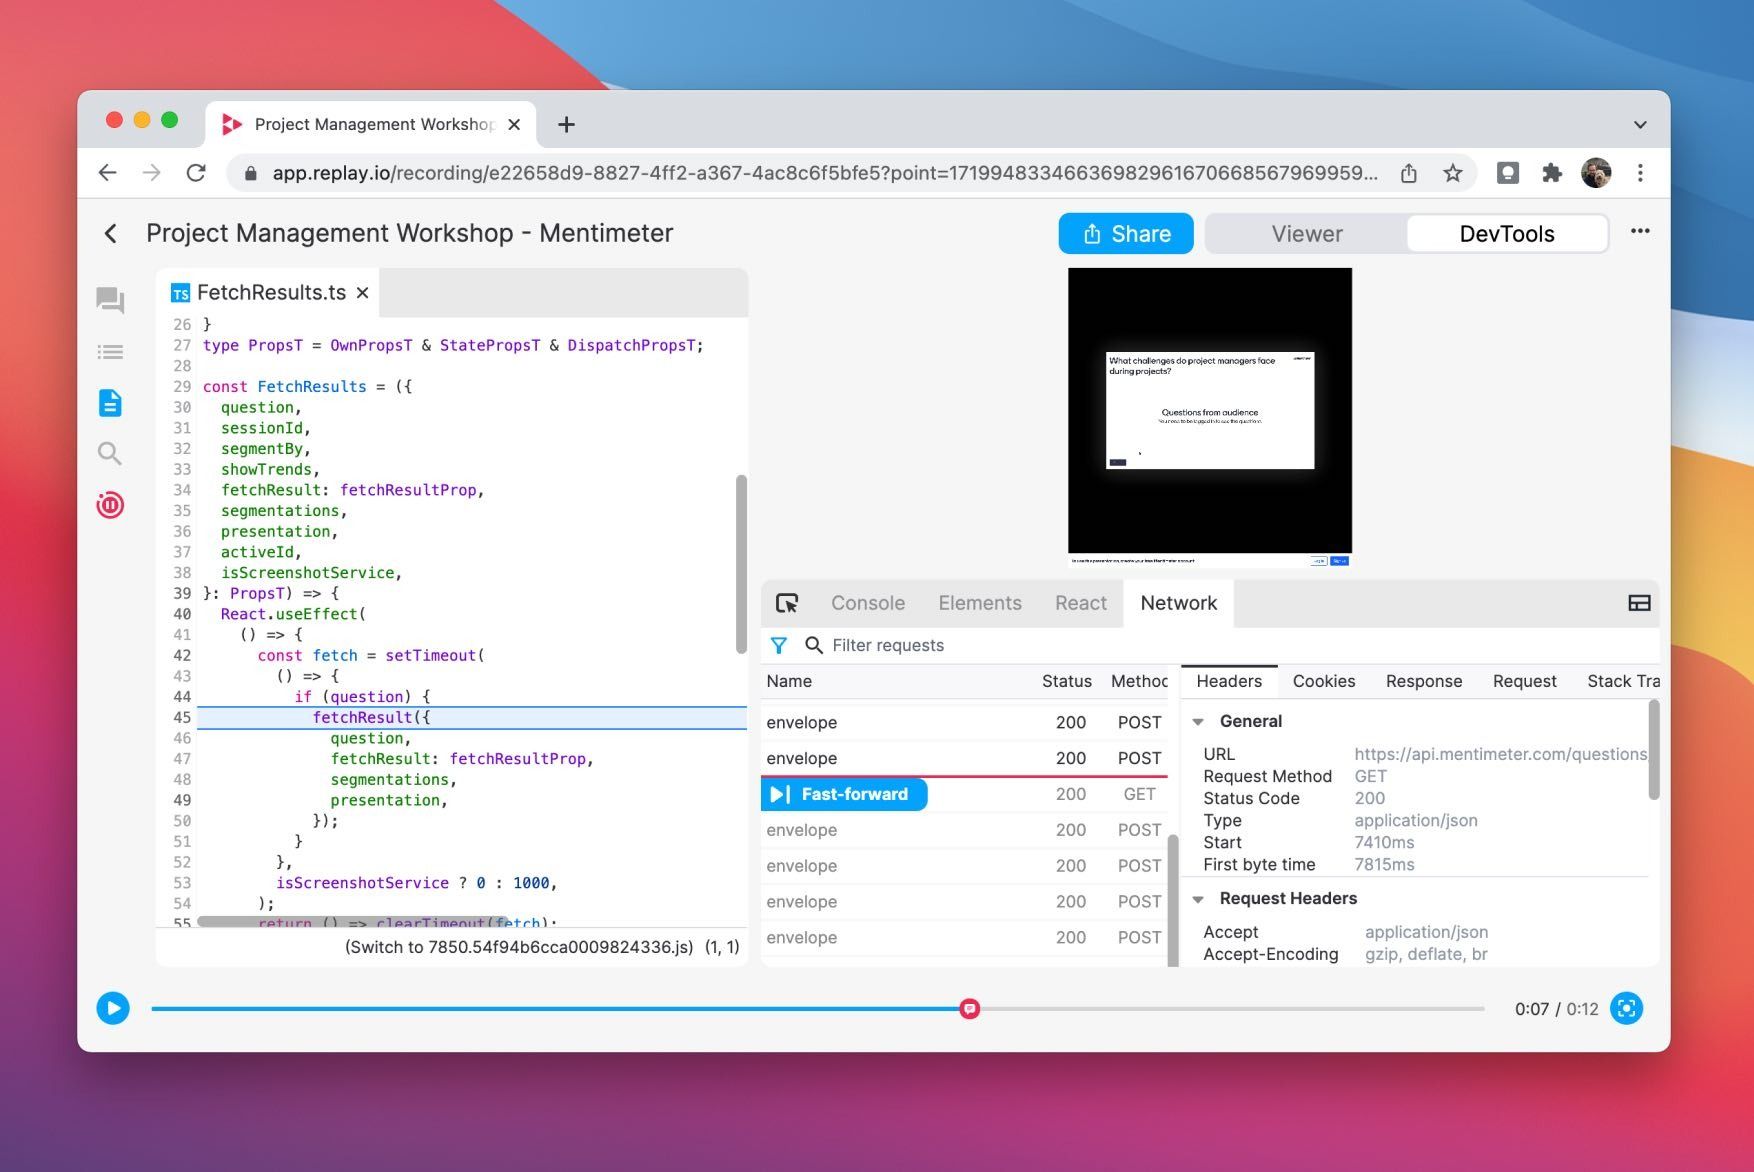
We're shipping an early version of the Network Monitor today 🚀 If you see any issues, send us a replay!
The Network Monitor is great for answering questions like... What requests were sent? What responses were received? What were the headers? What was cached? Who made the requests? Who handled the responses?
The Network Monitor includes common resources, their headers, and general information. It's also easy to fast-forward to any fetch! We're currently working on showing request and response bodies. We're also adding a couple of additional panels as well.
There's obviously lots to do. We'd love to hear what you'd like to see next!
Additional Updates
Elements Panel Launching On Demand Paints last week was a big deal. We’re now back to ironing-out edge-cases. Take it from us, HTML and CSS is complex 😂
Outline View The Outline View can now show 50K functions in a file without breaking a sweat.
Events Timeline We added a button so that you can jump directly to the function handling the click and keypress event. We’ll be applying some Replay time-travel magic soon so that you can land in the best position.
Case study
Unlike other weeks where we highlight other applications, this week we'd like to share a personal story about how the new Outline View nearly didn't ship because we were having a lot of issues with React hooks and memoization.
We were able to fix the new Outline View because we shared a replay with a friend who was able to add print statements in the component and see what we were doing wrong.
We're sharing this story because we want to normalize the fact that this stuff is hard, everyone has bugs, and it's okay to ask for help. At its core, Replay is all about being able to collaborate with others.
