

Today we are thrilled to release Replay for Test Suites. Test Suites join Bug Reports as an entirely new way to capture and fix hard-to-repro bugs.
Browser tests should not hurt
Browser tests are the only way to ensure that releases will not affect users negatively. But browser tests are brittle. Few teams are able to maintain them well. And nobody we’ve spoken to has said they “love” their browser tests!
The core problem is that because browser tests are painful to debug it’s easier to add timeouts and retries than fix the underlying problems. The problem is so bad, that over the past six months, two teams nuked their test suite and gave up!
There are two primary reasons why browser tests in CI are difficult to debug. First, they run in a blackbox. Second, they run as fast as possible.
Replay addresses the first problem because you can now record your tests and inspect the replays after the fact. Time travel addresses the second problem because time machines are particularly good at helping understand timing issues!
It’s about time!
Timing issues, otherwise known as race conditions, are some of the hardest issues to reproduce and debug. Historically, the top two causes were network latency and limited resources. Today, reactive programming patterns are introducing new classes of async issues. It doesn’t matter if your application uses React Hooks or Redux Thunks, it’s easy to introduce subtle timing issues that can be incredibly painful to pin down.
Fortunately, time-travel debuggers are really good at helping you understand timing issues. This is why many OSS maintainers like Tim Neutkins, Ryan Carniato, and Dom Saadi use Replay to debug Next’s App Router, Solid’s Concurrent Renderer, and Redwood’s session management.
It all starts with being able to test your hypothesis quickly. In Replay, you can add a console log to a line of code, and the expression will be retroactively logged to the Console. If there is a timing issue where a React component is rendered too late when the test fails, this will help you spot it.
Similarly, if there’s a slow Network request, Replay’s Network Monitor will help you inspect the slow request and jump to where the fetch originated or response was handled. If your application threw an exception, you can inspect the exception in the Console and jump to where the exception was thrown. And if your UI looks broken, you can inspect the React Component and jump to when the component was last rendered.
This is just the start. Because we’re able to introspect React’s component lifecycle and Cypress’s test runner, we’re able to bring far deeper insights into the inner workings of your application and testing harness.
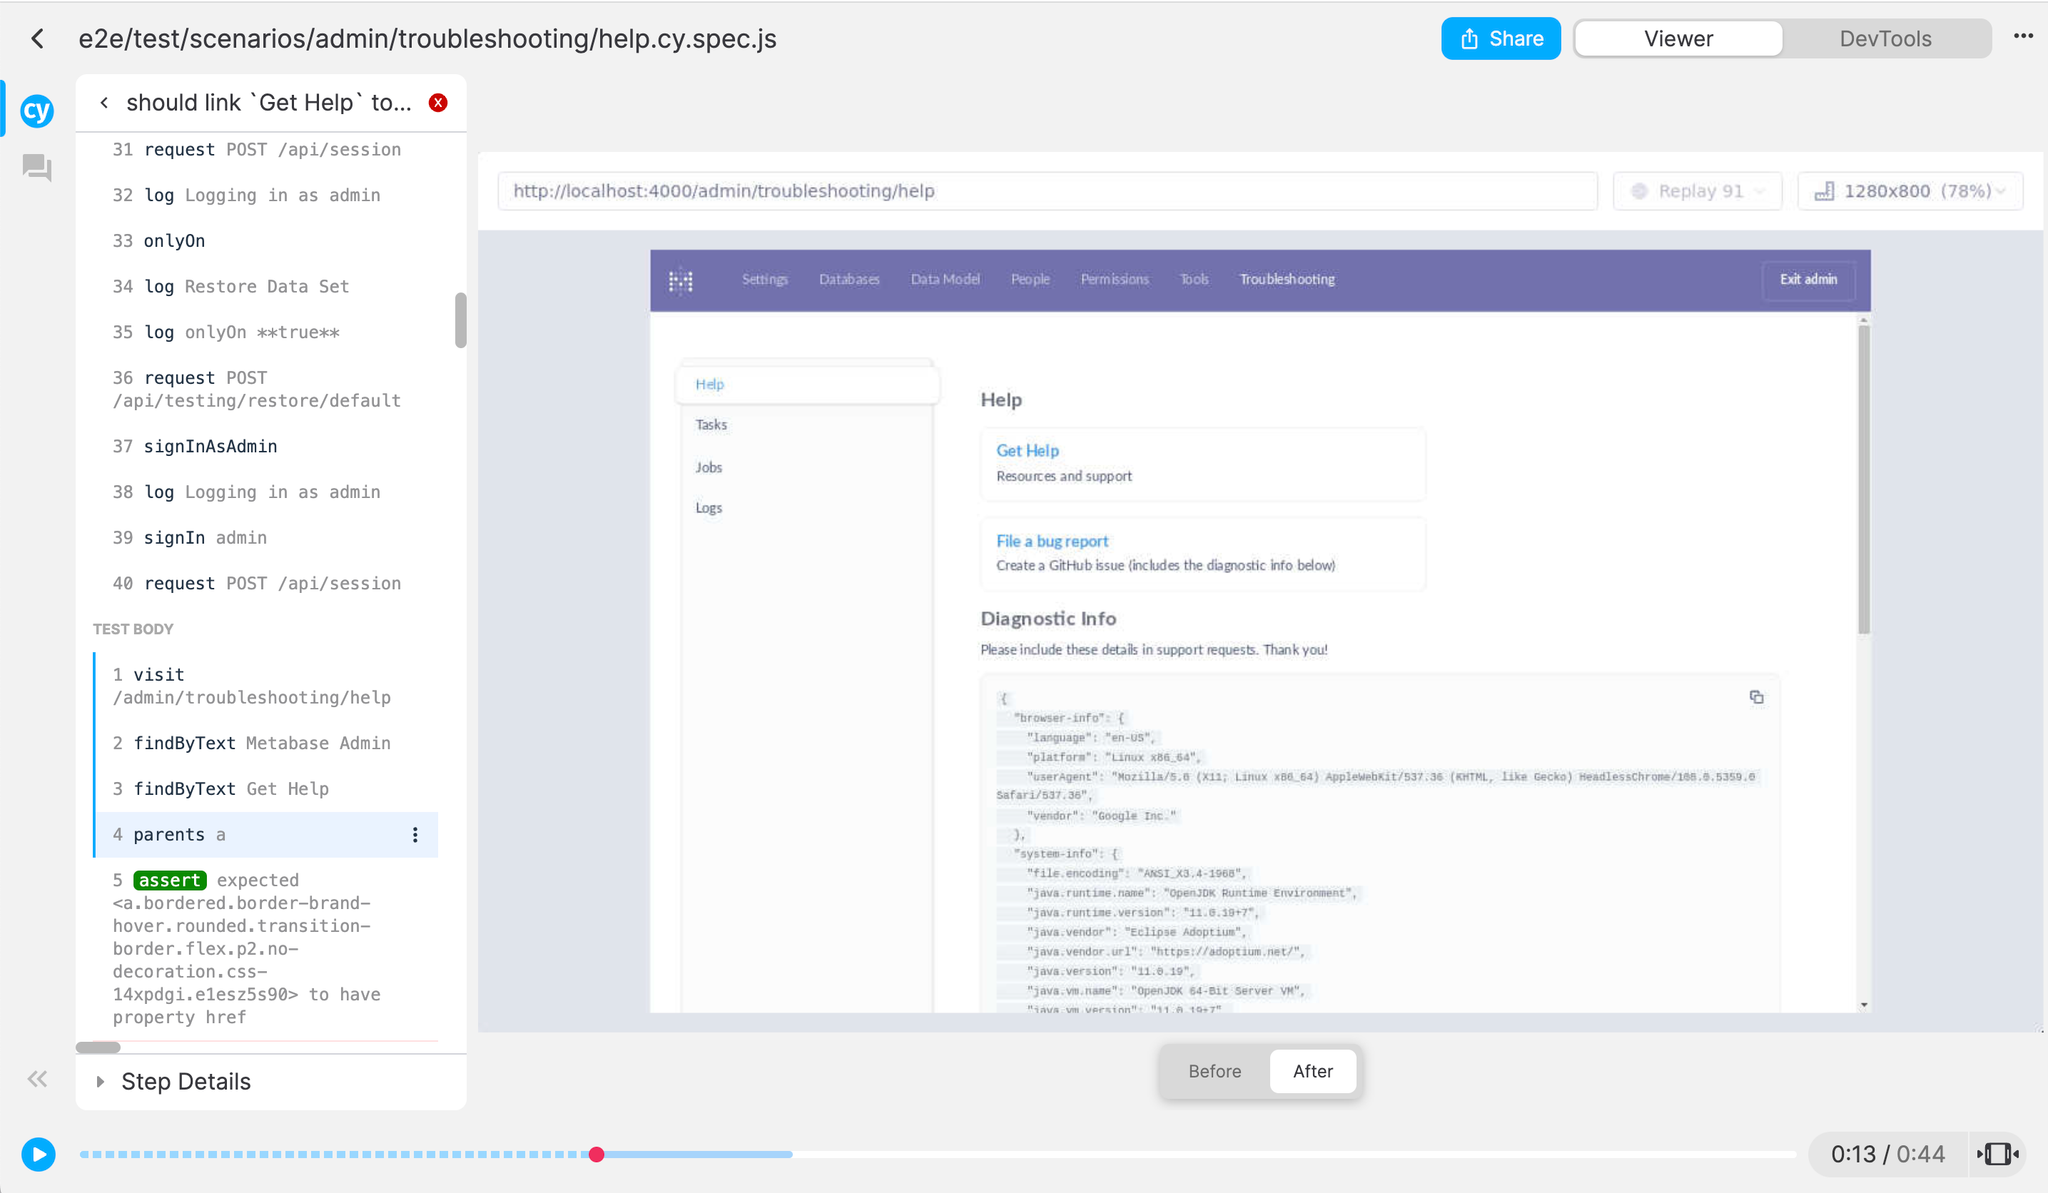
Introducing Cypress DevTools
Our biggest feature release last year was React DevTools. It’s fitting that this year, our biggest release is Cypress DevTools. In both cases, you’re now able to able to inspect your application as if it’s running live.
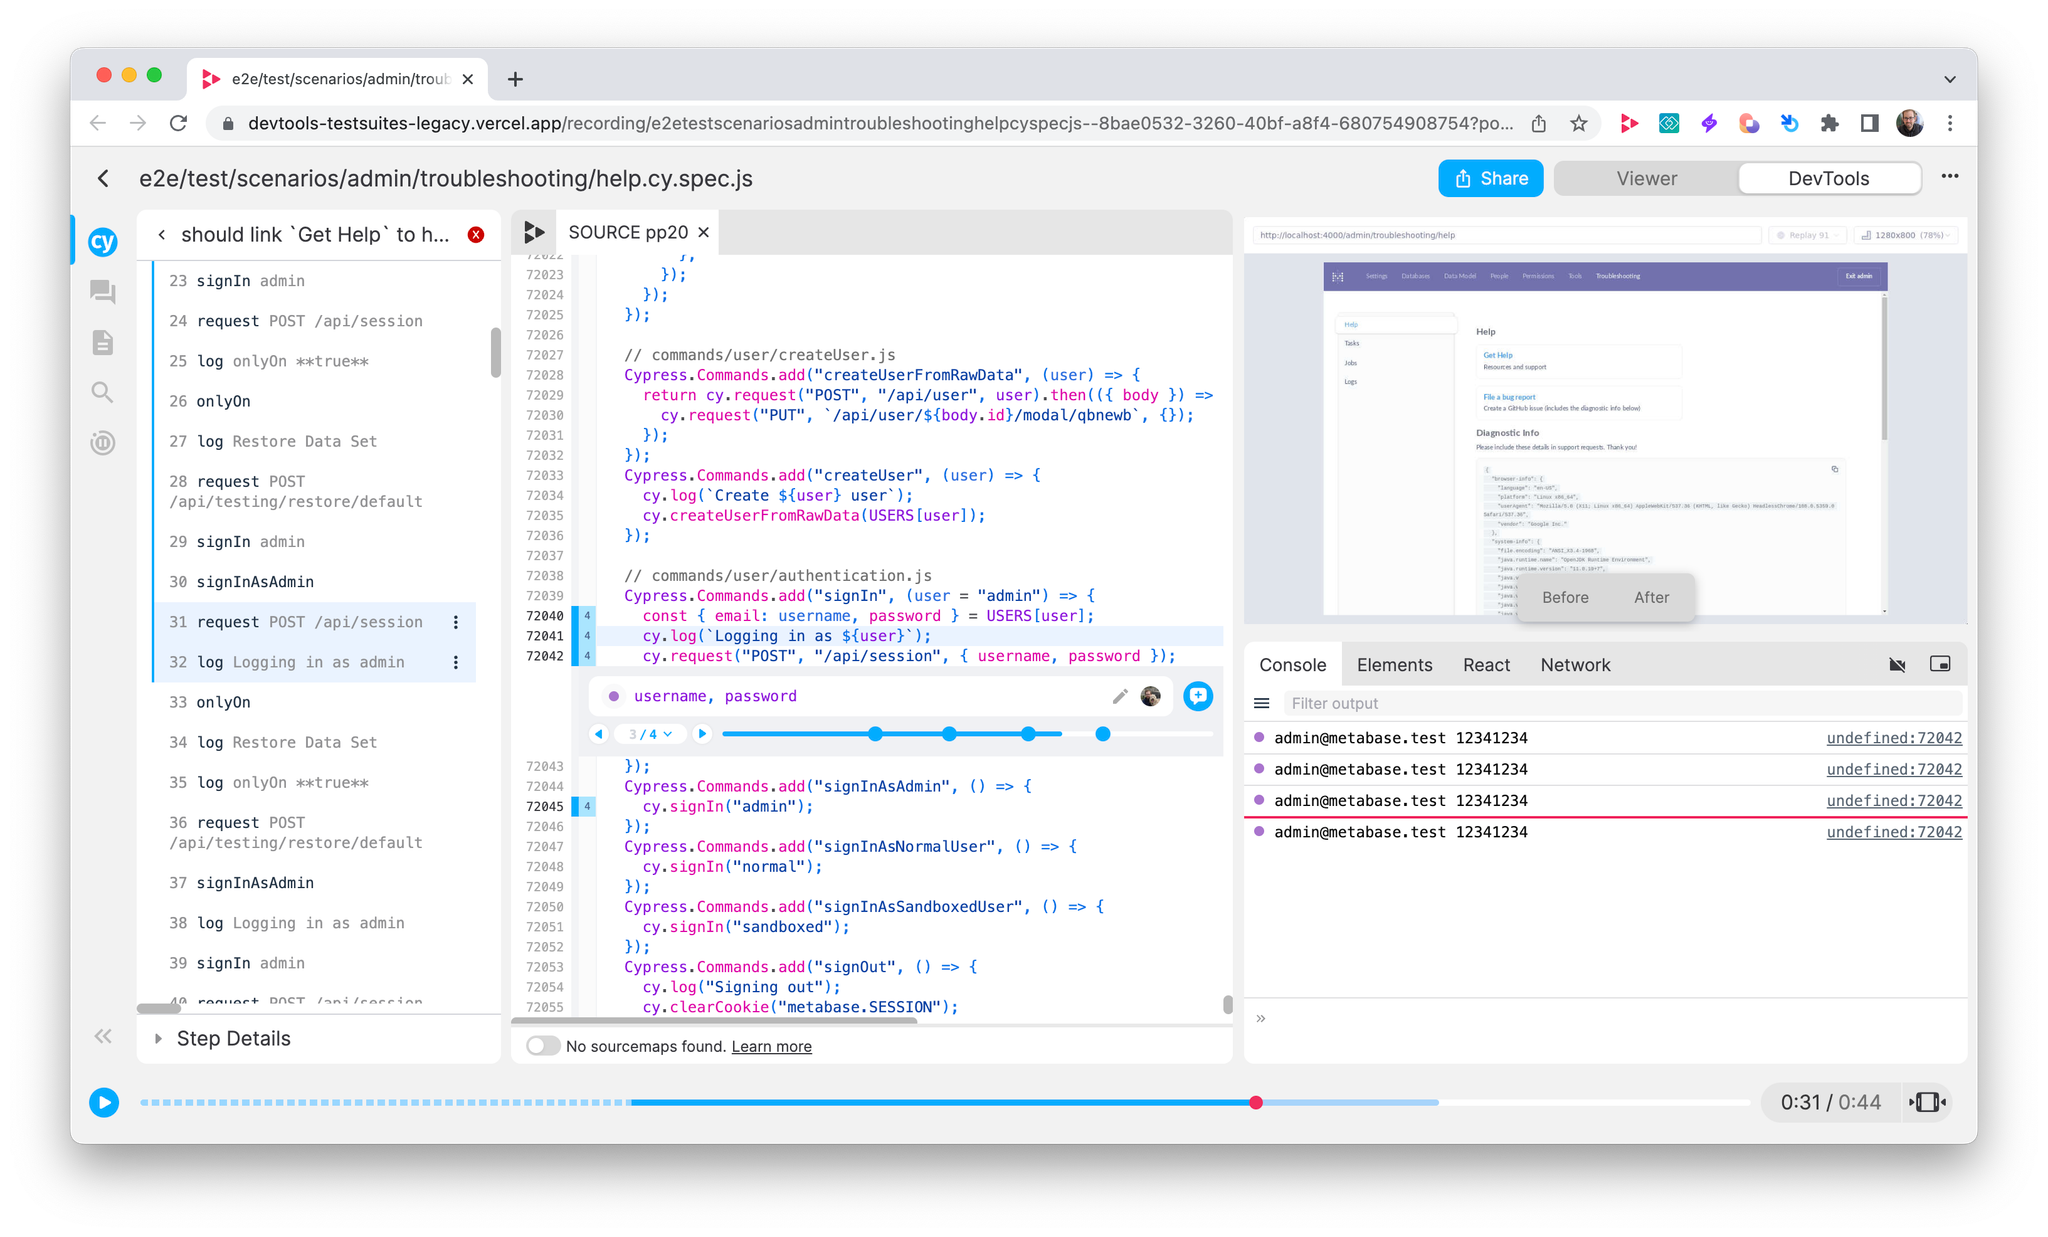
There are two features that make Cypress DevTools special.
The first is being able compare the Test Timeline to the Console. You can now see which console logs executed before and after each step and spot subtle timing issues.
The second is being able to jump from the test’s click event into your application’s click handler. This lets you quickly jump into your application’s logic and begin adding console logs.
We’re just getting started too. In the near future, we’ll be able to help identify performance and visual regressions and offer suggestions for how to run tests more efficiently and reliably.
And of course, none of these integrations and insights are Cypress specific. We are excited to bring the same functionality to Playwright and Selenium frameworks as well.
And when we release our Node recorder, you’ll be able to record your Jest unit tests and debug your React application from the frontend to the backend!
Getting Started
When we started we had three design goals.
- It should be as easy to start recording replays as videos
- Inspecting with Replay DevTools should be more powerful than browser DevTools
- Recording a replay should be lighter than a video or session replay
We’re thrilled with where we are.
- Setting up Replay is as simple as adding a single line to your Cypress config.
- Recording a replay today is faster than a video and comparable to a session replay.
- Debugging a flaky test in Replay is unlike anything else
javascriptsetupNodeEvents(on, config) { require("@replayio/cypress").default(on, config); // 🙋♂️ Add this line to install the replay plugin return config; },
One more thing
Chrome for Mac is going to Beta and Chrome for Windows is going to alpha. And unlike Firefox, Chrome for Mac will support both Intel and Apple Silicon!
Chrome for Mac and Windows will be helpful for recording tests locally and are also being designed so that they can become your primary development browser as well.
Actually… One more thing
None of this would be possible without the support of individual and institutional investors who have been true partners. Today, we’re proud to announce that we have raised a 13M Series A lead by IA with participation from a16z, Felicis, Nat Friedman, and Guillermo Rauch.
It’s been three years and nobody said that building a time machine would be easy, but the era of time travel is upon us 🚀