We’ve all seen the testing pyramid, with e2e tests taking place at the top, being the slowest and most expensive. A part of why the testing pyramid looks the way it does is that maintaining e2e tests is hard.
It seems there aren’t many that have been able to figure out how to drive down the cost of e2e tests and at the same time increase or keep the value. At least not at scale. This pushes teams to keep the number of e2e tests at a minimum, even though in an ideal world, we’d like to create tests that closely resemble the behavior of real users.
Teams around the world create many different strategies for combating test maintenance. Failed tests get skipped, or disabled altogether. Test suites get re-run in hopes of passing on retry. Countless hours are spent on debugging, frequently to be resolved by adding explicit waiting. Even the existence of the e2e test gets questioned, due to the maintenance cost. As teams get bigger and the number of tests grows larger the problem gets overwhelming.
The maintenance problem has been such a natural part of e2e test automation, that we no longer question it. But we should. If it would be possible to maintain more tests, more teams would afford to have a comprehensive suite.
This is the issue that we are tackling at Replay. We’ve been helping companies drive down their e2e test flake by getting a deeper understanding of what happens when an e2e script interacts with an application.
Over the past 6 months, we have been helping the team at Metabase, an open-source business intelligence software. Metabase runs hundreds of e2e tests daily, written in Cypress. We have been working on getting a better understanding of test failures and instabilities by recording their tests and deep-diving into their test runs with Replay DevTools. Together with the team, we went over hundreds of test runs and conducted root analyses of e2e test flakes.
Many of them are worth sharing with the world, so we decided to create a little blog post series where we’ll deep dive into the discovery journey.
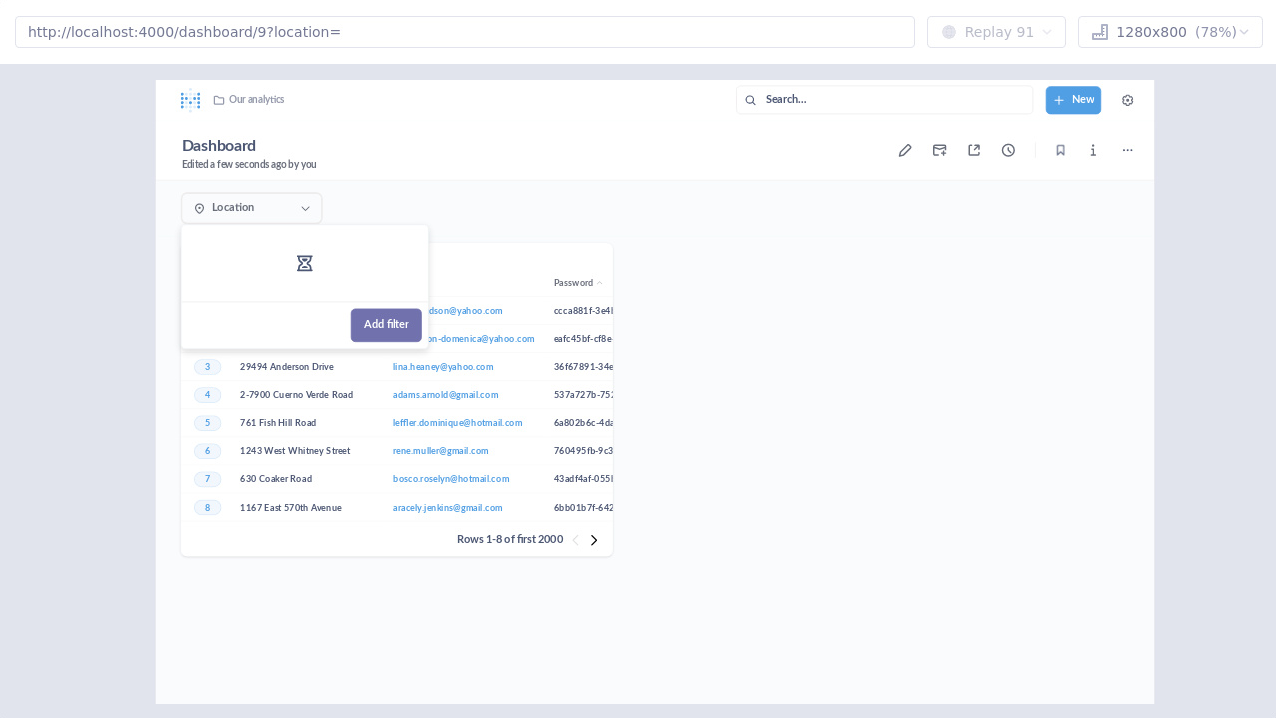
Case study: Testing loading spinners
The error on this one was as simple as they get:
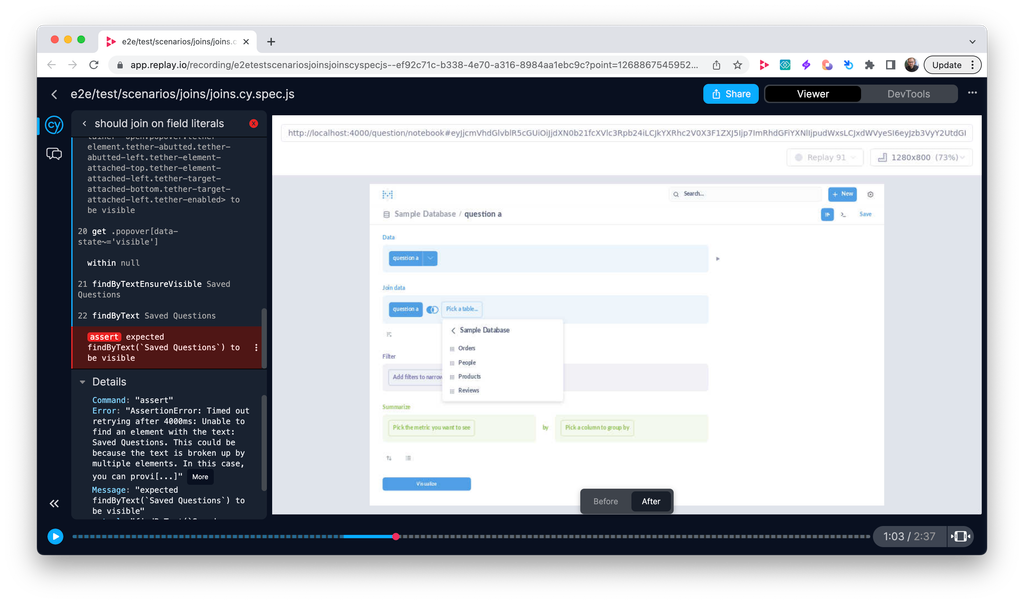
expected findByTestId(loading-spinner) to exist in the DOM. The test was validating the presence of a loading animation - a spinner icon that appears while filter options are being fetched from the server. The element that should have been found on the page did not appear, or rather the test could not find it.The test was recorded using Replay Browser on a GitHub Actions pipeline. Every test run produced a recording (which we call a replay) that can be examined using Replay DevTools as shown below. Every replay from the Cypress test contains the runtime recording of the application under test, as well as a Cypress panel that makes it easy to navigate through the test execution timeline. Clicking on any command in the panel (on the left side) will make the replay jump to the exact time when that command was triggered.
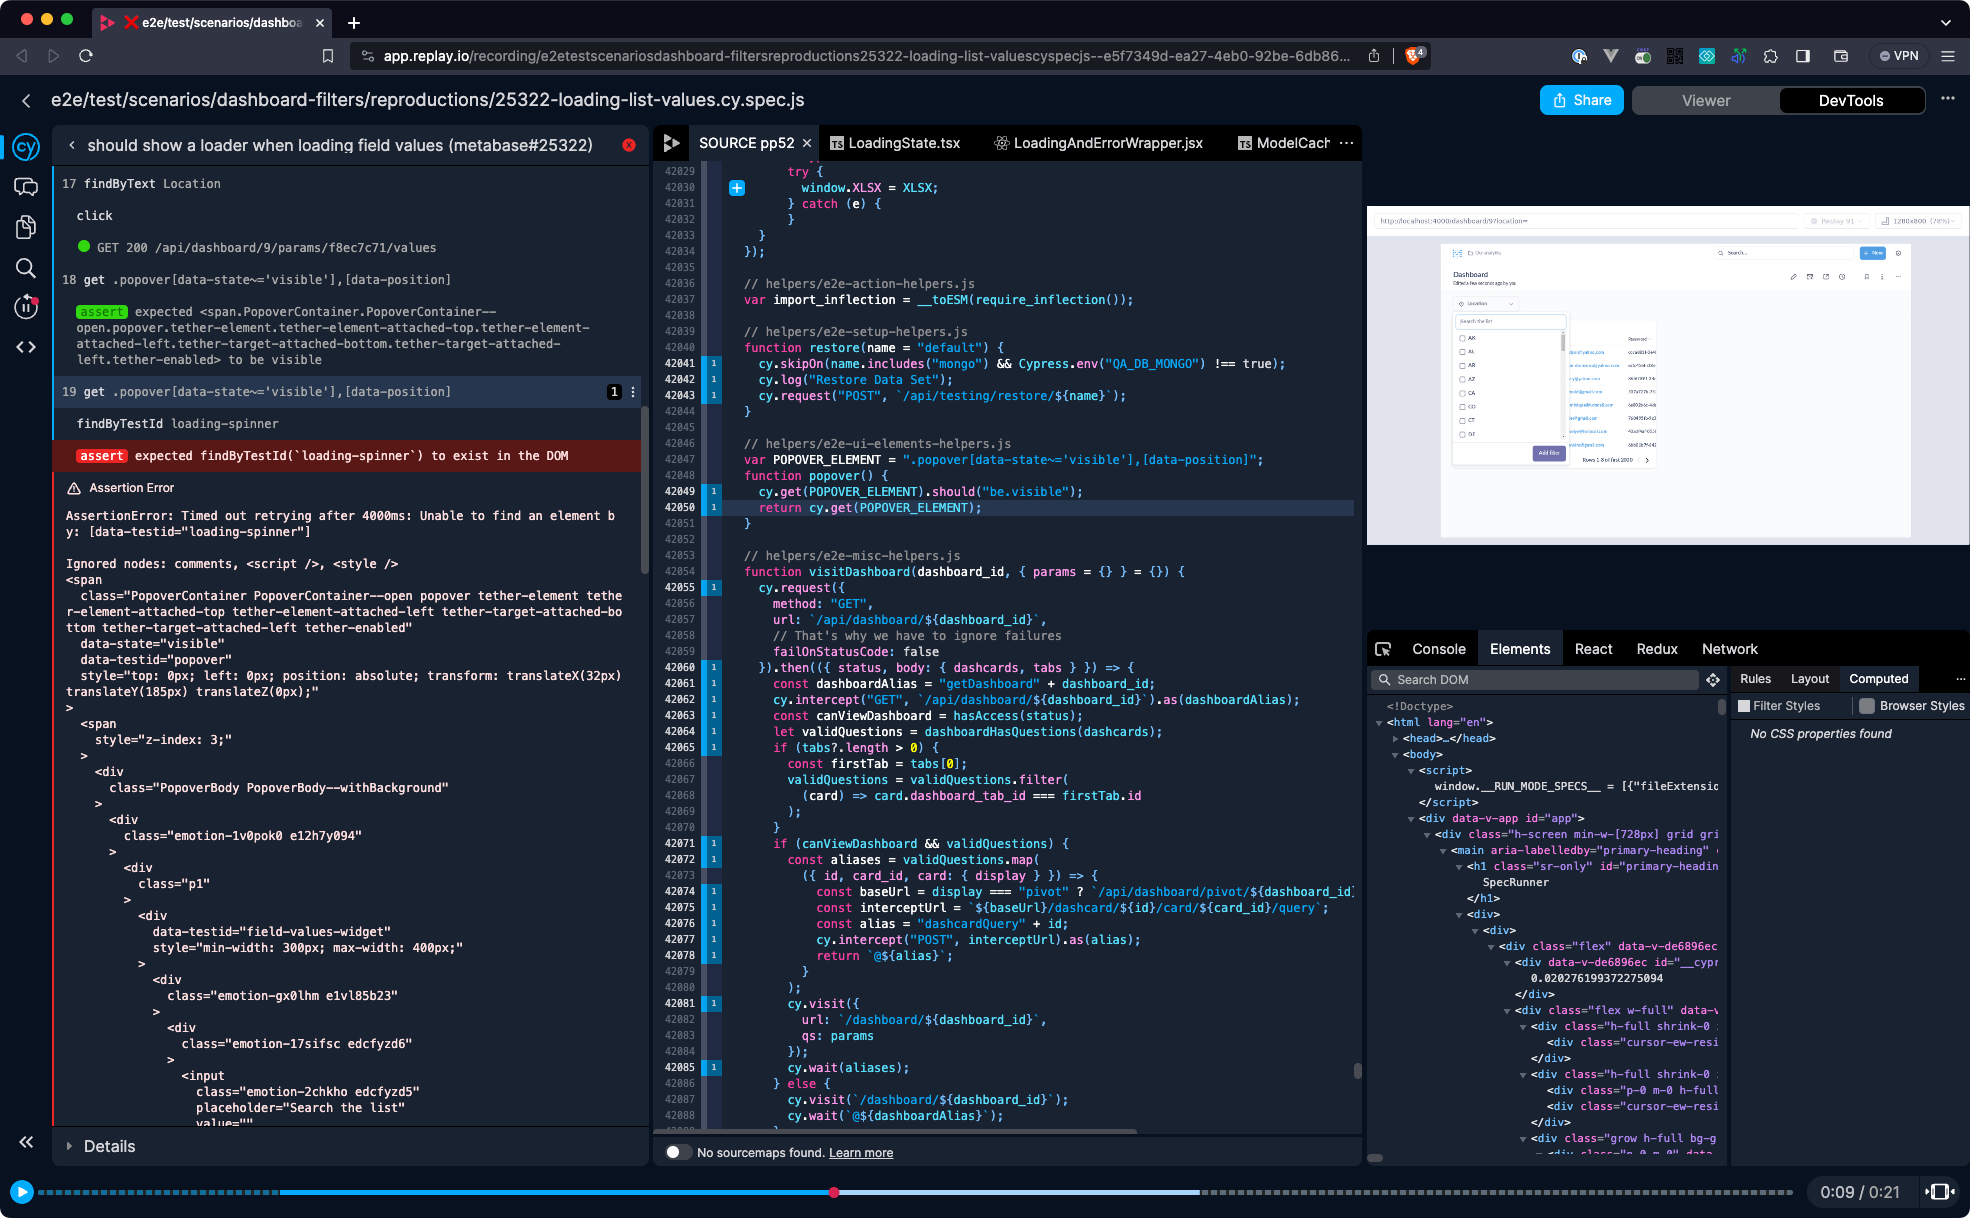
When jumping into the replay, it was obvious that there are no loaders in the application (as seen in the viewer on the top right) at the given moment of test execution. In other words, when the test selected the element using
cy.get('.popover[data-state~='visible'),[data-position"]) command, filter items were already loaded. This could be further confirmed by jumping into the elements panel and searching for loading-spinner element. The test seems to be failing for a valid reason, but we needed to confirm this. If not for any other reason, at least because it seems odd that a spinner element would suddenly disappear.
A quick search on the loading spinner reveals a
LoadingSpinner.tsx component that does seem to have been called 27 times during test execution as the counter in the gutter suggests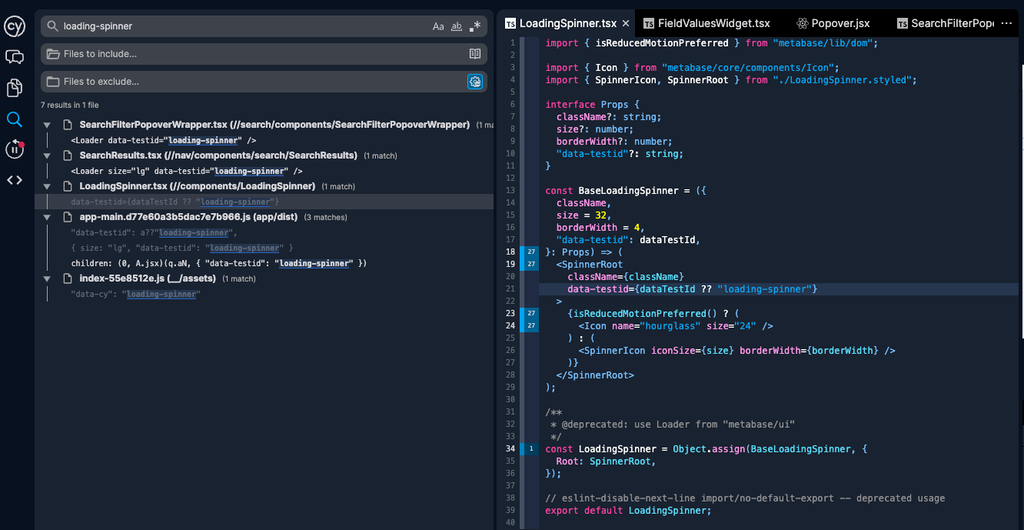
We can iterate over each line call by pressing
⌘ + click or ctrl + click.By iterating over every component call, we can see the spinner element appear in the viewer. This finding is really valuable because we have now confirmed, that the element does appear, but our test is unable to find it. This led to the conclusion, that maybe the loading shows for too short a period of time.
When looking at the test definition, it was clear that this was indeed a risk that was expected. A function that was supposed to mitigate this risk was set up to slow down the API call that loads elements in this field. When slowed down, a spinner element will appear for a longer period, making it possible for the test to validate its presence. The function looked like this:
javascriptvar throttleFieldValuesRequest = (dashboard_id) => {
    const matcher2 = {
      method: "GET",
      url: `/api/dashboard/${dashboard_id}/params/${parameterDetails.id}/values`,
      middleware: true
    };
    cy.intercept(matcher2, (req) => req.on("response", (res) => res.setThrottle(10)));
  };
})
The
setThrottle is a Cypress function that allows to limit bandwidth by kbps. This is a good method of slowing things down, but it is susceptible to changes in the API response size. In other words, if the response size shrinks, the response will be faster.This was exactly the cause of the test failure. As the response got leaner, Cypress test was not able to capture the spinner element.
A suggested change stabilized this test by instead using
setDelay function, so that the period of time during which a loader spinner element is shown is consistent.diff- cy.intercept(matcher, req => req.on("response", res => res.setThrottle(10))); + cy.intercept(matcher, req => req.on("response", res => res.setDelay(100)));
Normally it’s difficult to test changes that could happen really quickly, especially when the backend is out of control. But with Replay, it doesn’t matter if the response comes back in 10ms or 100ms. Replay protocol captures the operating system calls, so even if an element renders for a short period it can be observed. This makes Replay different from session recorders such as those present in Cypress or Playwright.
As mentioned in the beginning, test maintenance cost can grow frustratingly high. But a part of that maintenance can be very efficiently mitigated by getting a proper insight into your test run. You can get more insight too. Check out our documentation to see how you can create your first recording or integrate Replay into your e2e test suite.