Even seemingly minor changes to your code can have unexpected consequences for your e2e tests. We have been repeatedly learning this lesson while helping Metabase drive down their e2e test flakes.
In past six months, we’ve been collaborating with Metabase. We’ve integrated Replay into their existing Cypress test suite and helped with analysis of flaky and failed tests.
Some of the cases are definitely worth sharing with the world. This blogpost describes one of those cases. It ends with an interesting twist - what looked like a functional problem ended up being a small alteration in styling. That little change led to the failure of a previously reliable end-to-end test.
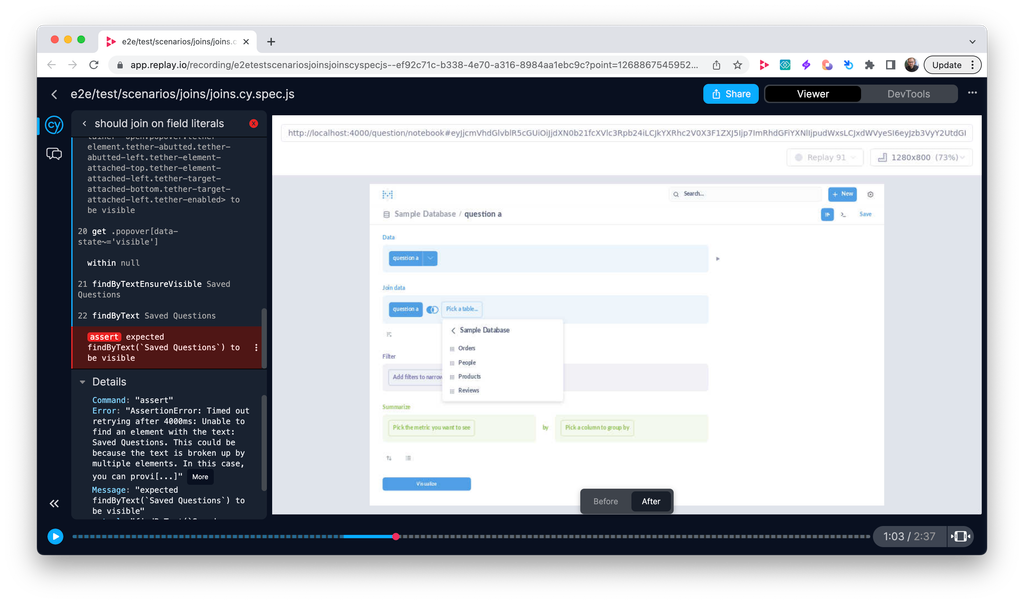
This blogpost describes the debugging process that led us from the initial error message to finally discovering the underlying problem, all using Replay DevTools.
This is the second part of a series about driving down test flakes to 0% at Metabase. Make sure to check out the first part as well. It describes a different test flake and a process of discovering it and applying a fix.
Case study: Styling change that broke the test
A test failure returned a very straightforward error message:
plain textAssertionError: Timed out retrying after 4000ms:
expected '<span.rounded.flex.align-center.text-bold.cursor-pointer>'
to have text 'Created At is Apr 1, 12:00 AM – Sep 1, 2022, 12:00 AM',
but the text was 'Created At is May 1, 12:00 AM – Sep 1, 2022, 12:00 AM'
The original intention of the test was to select a date range in a graph. When user drags their cursor across the graph, they’ll zoom to a selected date range. The test failure basically pointed to a fact, that the selected date range was not correct. We were getting “May 1” instead of ”Apr 1”.
Step #1: Check the test definition
The test did not show any obvious information on what went differently in a failed test when compared to successful test. The test definition was pretty straightforward. The test opened the application on a certain viewport, made a drag & drop action that triggered an API call and then the test validated that the range was in fact selected:
javascriptit("should apply filters to the series selecting area range", () => {
  cy.viewport(1280, 800);

  visitQuestionAdhoc({
    dataset_query: testQuery,
    display: "line",
  });

	// select date range drag & drop
  cy.get(".Visualization")
    .trigger("mousedown", 100, 200)
    .trigger("mousemove", 230, 200)
    .trigger("mouseup", 230, 200);

  cy.wait("@dataset");

  cy.findByTestId("filter-pill").should(
    "have.text",
    "Created At is Apr 1, 12:00 AM – Sep 1, 2022, 12:00 AM",
  );

  cy.get(".Visualization .dot").should("have.length", 6);
});
Step #2: Check network communication
In every test investigation, it is important to understand the context of what the test was trying to do. This is especially true for e2e tests that usually carry much more complexity. In this case, it made sense to look at the network panel and examine the
/api/dataset API call, that was called right after the .trigger() commands in our tests. The /api/dataset API call is responsible for fetching the proper information from server after a date range was selected.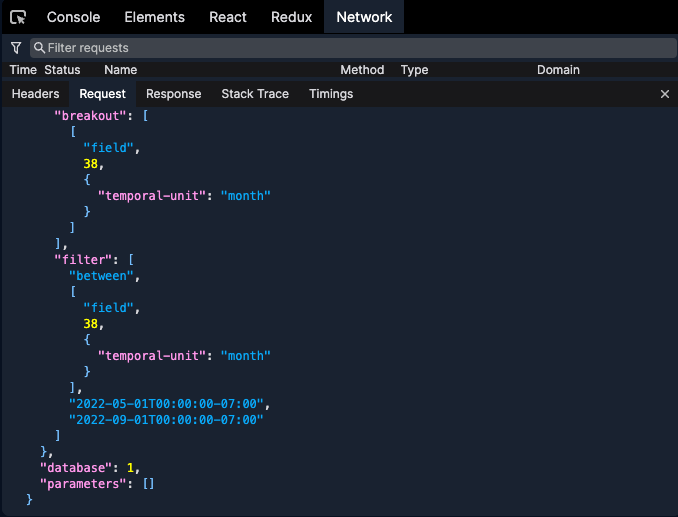
This is our first clue. When examining the request body, we have found that the app was indeed requesting a range from 1st May, instead of 1st April. So why was there a change in the failed test compared to passed one?
The test uses a series of
trigger() commands that simulate drag and drop. As an argument in these commands, the test passes specific pixel coordinates. This gives us some context on why .viewport() command is being used at the beginning of this test. Could the coordinates be wrong? Step #3: Check for visual differences
At first glance it didn’t seem to be the case, but a comparison in Viewer revealed the slightest shift between failed and successful test. Notice how the font weight on the axis changes in the following video as we switch between passing and failing test. With the font change, the whole line graph shifts too, but the selection range sits steadily in the same place.
This shift was enough to select a slightly different date range and make the test fail. Although
trigger() command coordinates were pretty deterministic, the changed nature of the application under test made a difference that caused a different test result.Step #4: Resolution
The stabilization of this test basically required to update the coordinates passed into the
trigger() command. The styling change was intentional and therefore the test started failing. Conclusion
In cases like this, it is really hard to draw connection between the test error message and changes made to the application. As mentioned in the beginning, what might at first look like a functional problem might be disconnected from functionality completely. Without a proper insight into the application under test, it’s practically impossible. This is where Replay DevTools are unique in their debugging capability. The test result carries pass/fail information, but a replay of the test carries the answer to why a certain test failed.
Without proper insight into test failures it’s really easy to develop an alarm fatigue and just let a certain test fail, or decide to remove it from a test suite. You can get more insight too. Check out our documentation to see how you can create your first recording or integrate Replay into your e2e test suite.