
Debugging failures in automated tests is often pretty difficult. Seeing what happened when the test ran, accessing an environment where the failure can be reproduced, and adding diagnostic logging and repeatedly re-running the test to identify the source of the problem can all be time consuming processes.
Failures that only happen occasionally (flaky tests) or disappear after adding logging (heisenbugs) are even harder to understand. These usually can’t be debugged with the available techniques, and require complex reasoning about what could have caused them in order to make progress. Most often, tests with failures like this end up getting disabled, or the failures are simply tolerated. None of these approaches are satisfactory.
Replay offers a modified version of Chromium that creates recordings of test failures which can be inspected directly with a time travel debugger. Recordings capture everything that happened when the test originally ran, with low overhead of around 10%. A single replay of a test failure (or any other bug) is enough to figure out what went wrong.
In this post we’re going to dive into a replay of a test failure in the Metabase open source app. This is a flaky test: it only fails sometimes, is highly timing sensitive and the rate at which it fails varies between different testing configurations. None of this matters though. Once we have the replay, we can fully understand the failure and what is needed to fix it.
About Replay
There are many tools like Deploy Sentinel and Cypress Cloud that record a video of the test, changes to the DOM, console logs, network requests and so forth. Although this is only a small slice of the test’s behavior, it can aid understanding and will sometimes be enough (in combination with the developer’s knowledge of the code base and intuition) to fix the problem. Usually it’s not enough though, and the time consuming debugging process described above is still needed.
Replay is different from these tools. Instead of recording things that happen during a test, Replay records the inputs to the browser and its internal non-determinism. This recording can be used later to re-run the browser and deterministically perform the same behaviors that originally happened during the test. From this we can derive not just the basic video, DOM, console, and network data but also absolutely everything else that happened, like all the JavaScript which executes and the value of every variable and object property at every JavaScript statement. See this blog post series How Replay Works to learn more about Replay’s recorder.
The Failure
The test we’ll be looking at is part of Metabase’s cypress test suite. Within the spec file
joins.spec.cy.js the subtest "should join on field literals" performs these steps:- two questions “a” and “b” are created via the API
- the test clicks on Saved Questions and then selects question “a”
- clicks the join button
- clicks on Saved Questions a second time and then selects question “b”
- visits the visualize page and waits for columns resulting from the join to appear.
When the test fails, it is not able to select the second question in step 4. The screenshots below show that different content is rendered in the successful vs. failed runs, and there is no “Saved Questions” text to click on in the failed run.
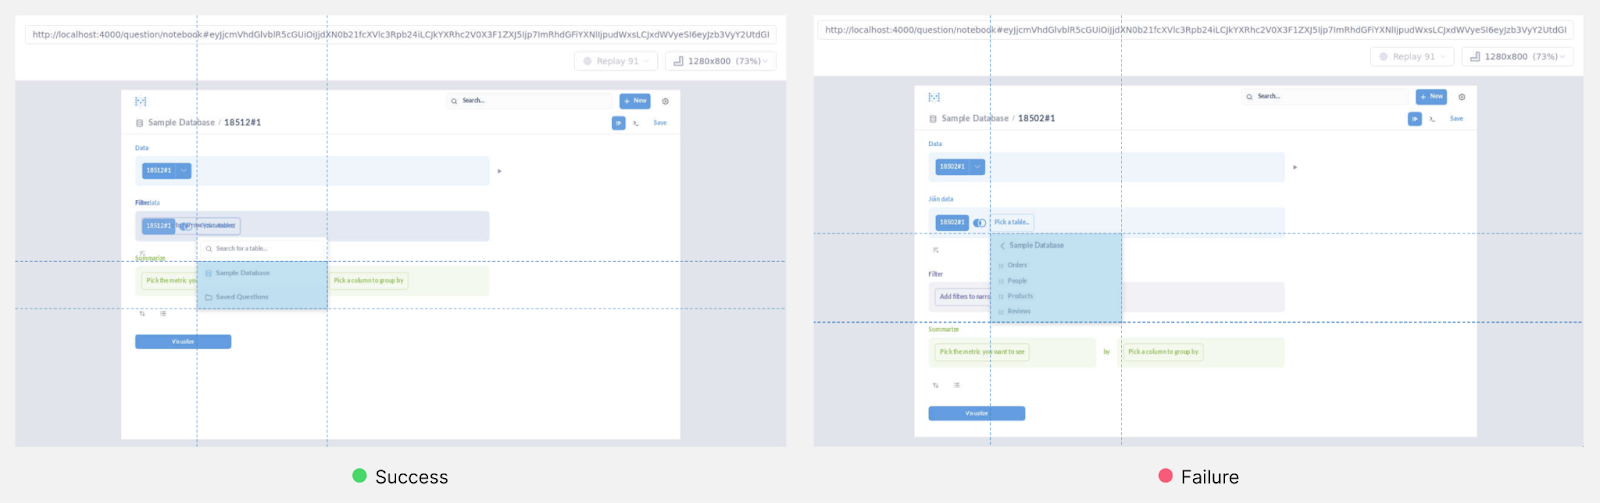
If all we had was a video of the test or the changes that were made to the DOM while the test was running, this is about as far as we could get. The page rendered the wrong table in the failed run, but there would be no information about what was rendered or any of the steps leading up to that.Instead, we’ll be looking at a replay of the test failure.
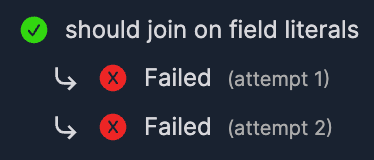
Retries were enabled when this was recorded, so this replay includes two failed runs of the test and a later successful run. Being able to directly compare the behavior in the failed vs. successful runs will make it easier to debug the failure.
Let’s go Debugging
Our goal whenever we’re debugging is to work our way backwards from the problem along some number of intermediate steps to whatever the original cause is which led to the problem. Using a time travel debugger for this is very helpful as we can jump back in time and see all the state at those intermediate steps without having to keep reproducing the bug with added logging or within a regular debugger.
So, let’s break down this test failure into a series of steps from the problem leading back to the original cause.
Step 1: Incorrect DOM
As we saw earlier the final step which caused the test to fail is that the wrong DOM was rendered, and the test wasn’t able to find the text it expected.
We could jump to this point in the recording and look at the state of the DOM, but this is a React application and it would be more helpful to look at the React components instead. Replay’s debugger provides React devtools which work in a similar way to those in a regular debugger, except that the React state at any point in the recording can be inspected.
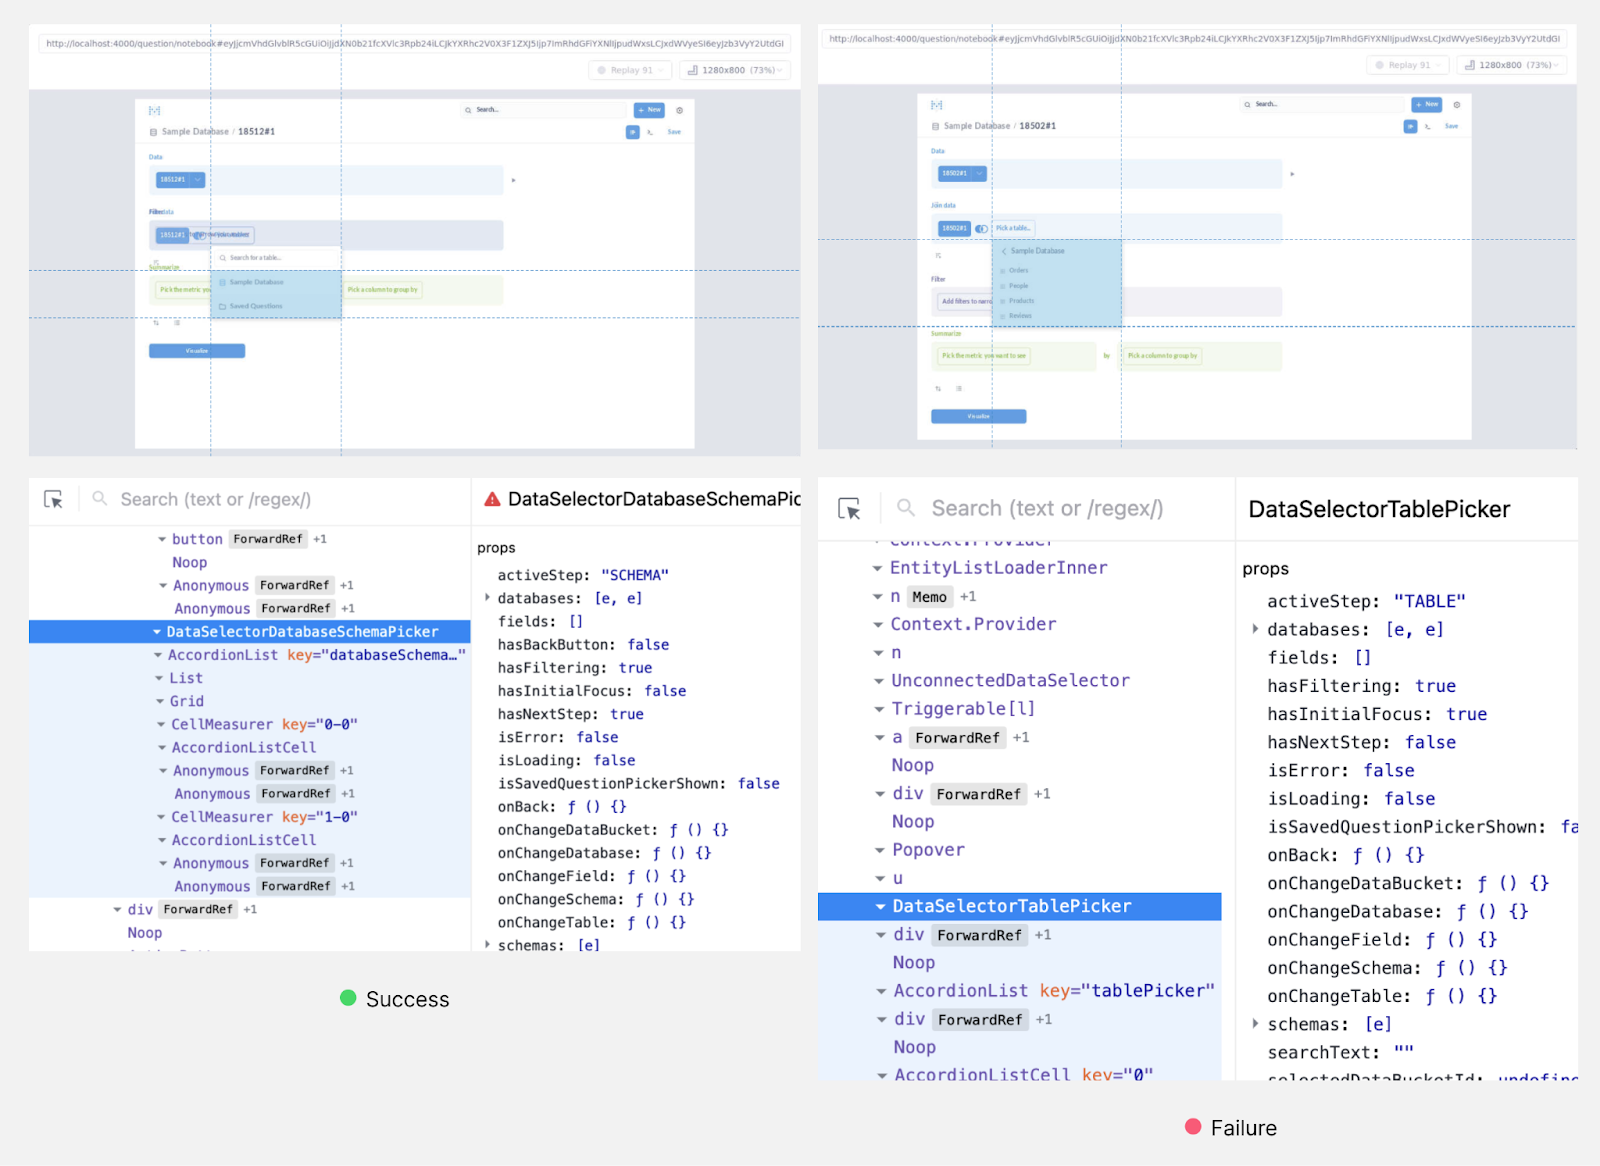
Visiting the point where the test passes and has the “Saved Questions” text shows that the table with that text is a
DataSelectorDatabaseSchemaPicker component. At the corresponding point in the failure, the table missing the “Saved Questions” text is a DataSelectorTablePicker component.We need to figure out why the test rendered a
DataSelectorTablePicker component instead of a DataSelectorDatabaseSchemaPicker component.Step 2: Rendering a DataSelectorTablePicker
Let’s look at the JavaScript behavior to see why the app created and then rendered different components. Searching the source code shows that
DataSelectorTablePicker and DataSelectorDatabaseSchemaPicker components are both only created by a particular function renderActiveStep in DataSelector.jsx. This does a switch statement on a value this.state.activeStep and renders different components based on the result. We can add a print statement at this switch statement which retroactively adds console logs for each point this statement executed. Let’s log the value of this.state.activeStep and compare the logged messages in the successful vs. failed runs.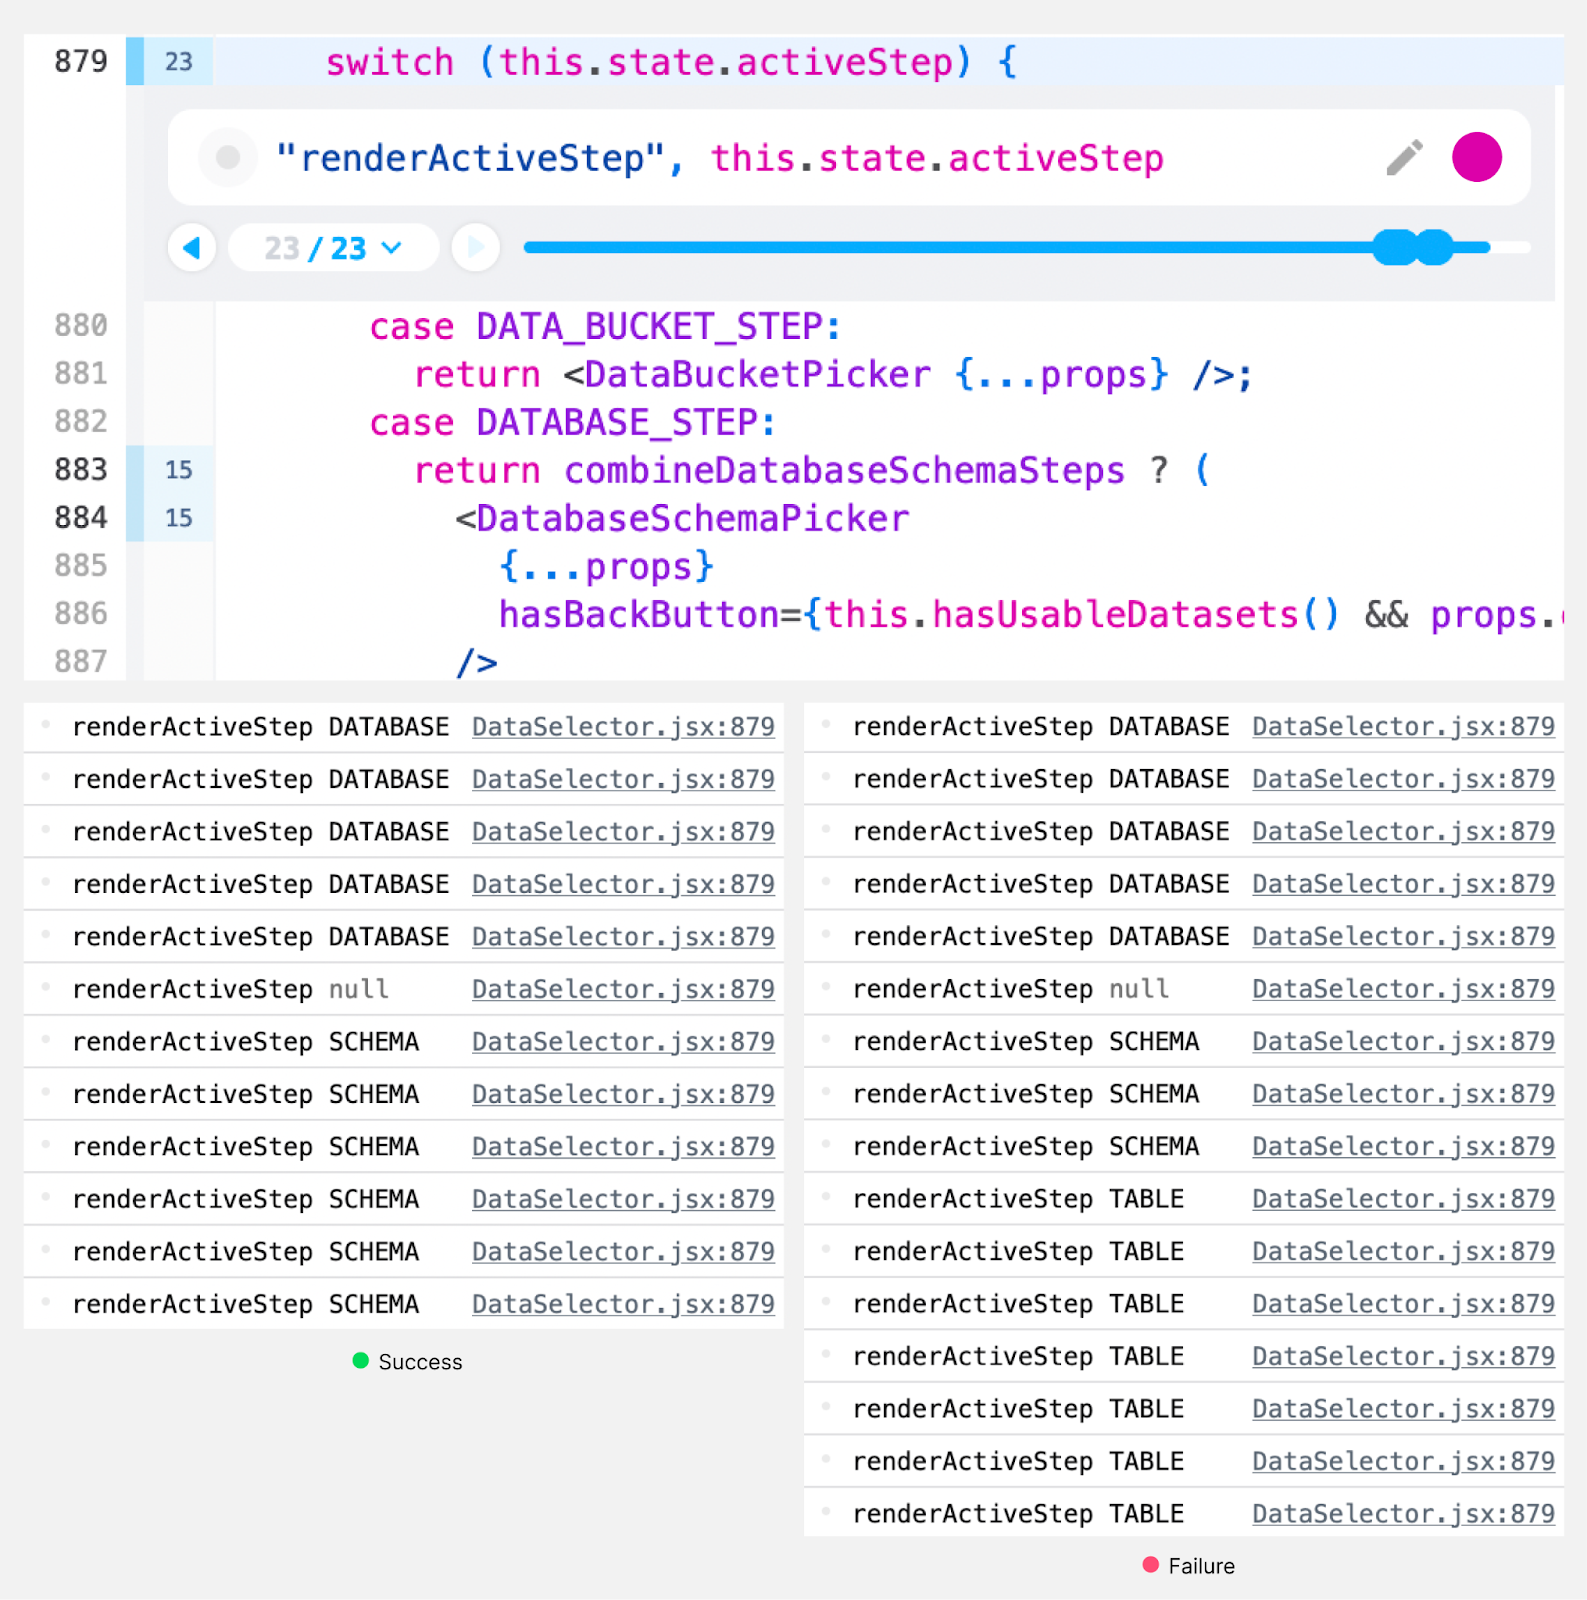
We see different behavior. In the successful run the
DATABASE case is taken several times, and then the SCHEMA case is taken several times. In the failed run the same thing happens, but after the SCHEMA cases the TABLE case is additionally taken several more times.The
TABLE case will cause the erroneous DataSelectorTablePicker component to be created. Let’s keep digging to figure out why this.state.activeStep is TABLE.Step 3: this.state.activeStep is TABLE
Looking through
DataSelector.jsx shows that the active step is updated by the switchToStep function, which sets the active step to the value of its stepName parameter. We can add a print statement on this function to see the places it is called.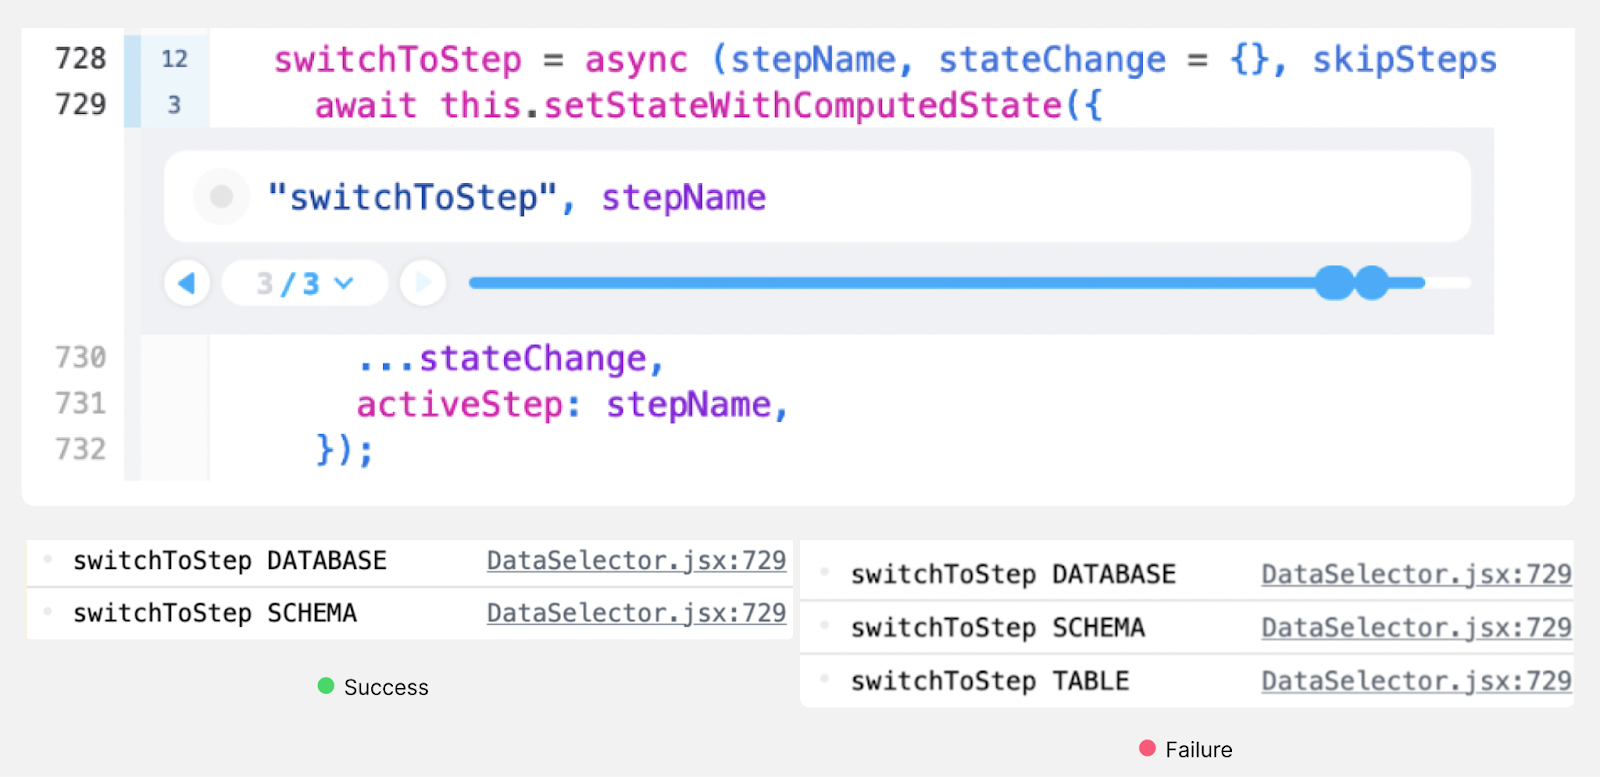
In the successful run it is called with
DATABASE and then with SCHEMA. In the failed run it is additionally called with TABLE. That last call looks like the problem.Step 4: switchToStep(TABLE) is called
We can jump to the point where
switchToStep(TABLE) is called and inspect the call stack. The immediate caller is in nextStep, which is called by onChangeSchema, which is in turn called by skipSteps when a branch if (schemas && schemas.length === 1) is taken. This if statement is hit in both the successful and failed runs, but in the successful run the branch is not taken and neither onChangeSchema nor nextStep ever execute. Let’s add a print statement to see the schemas array contents.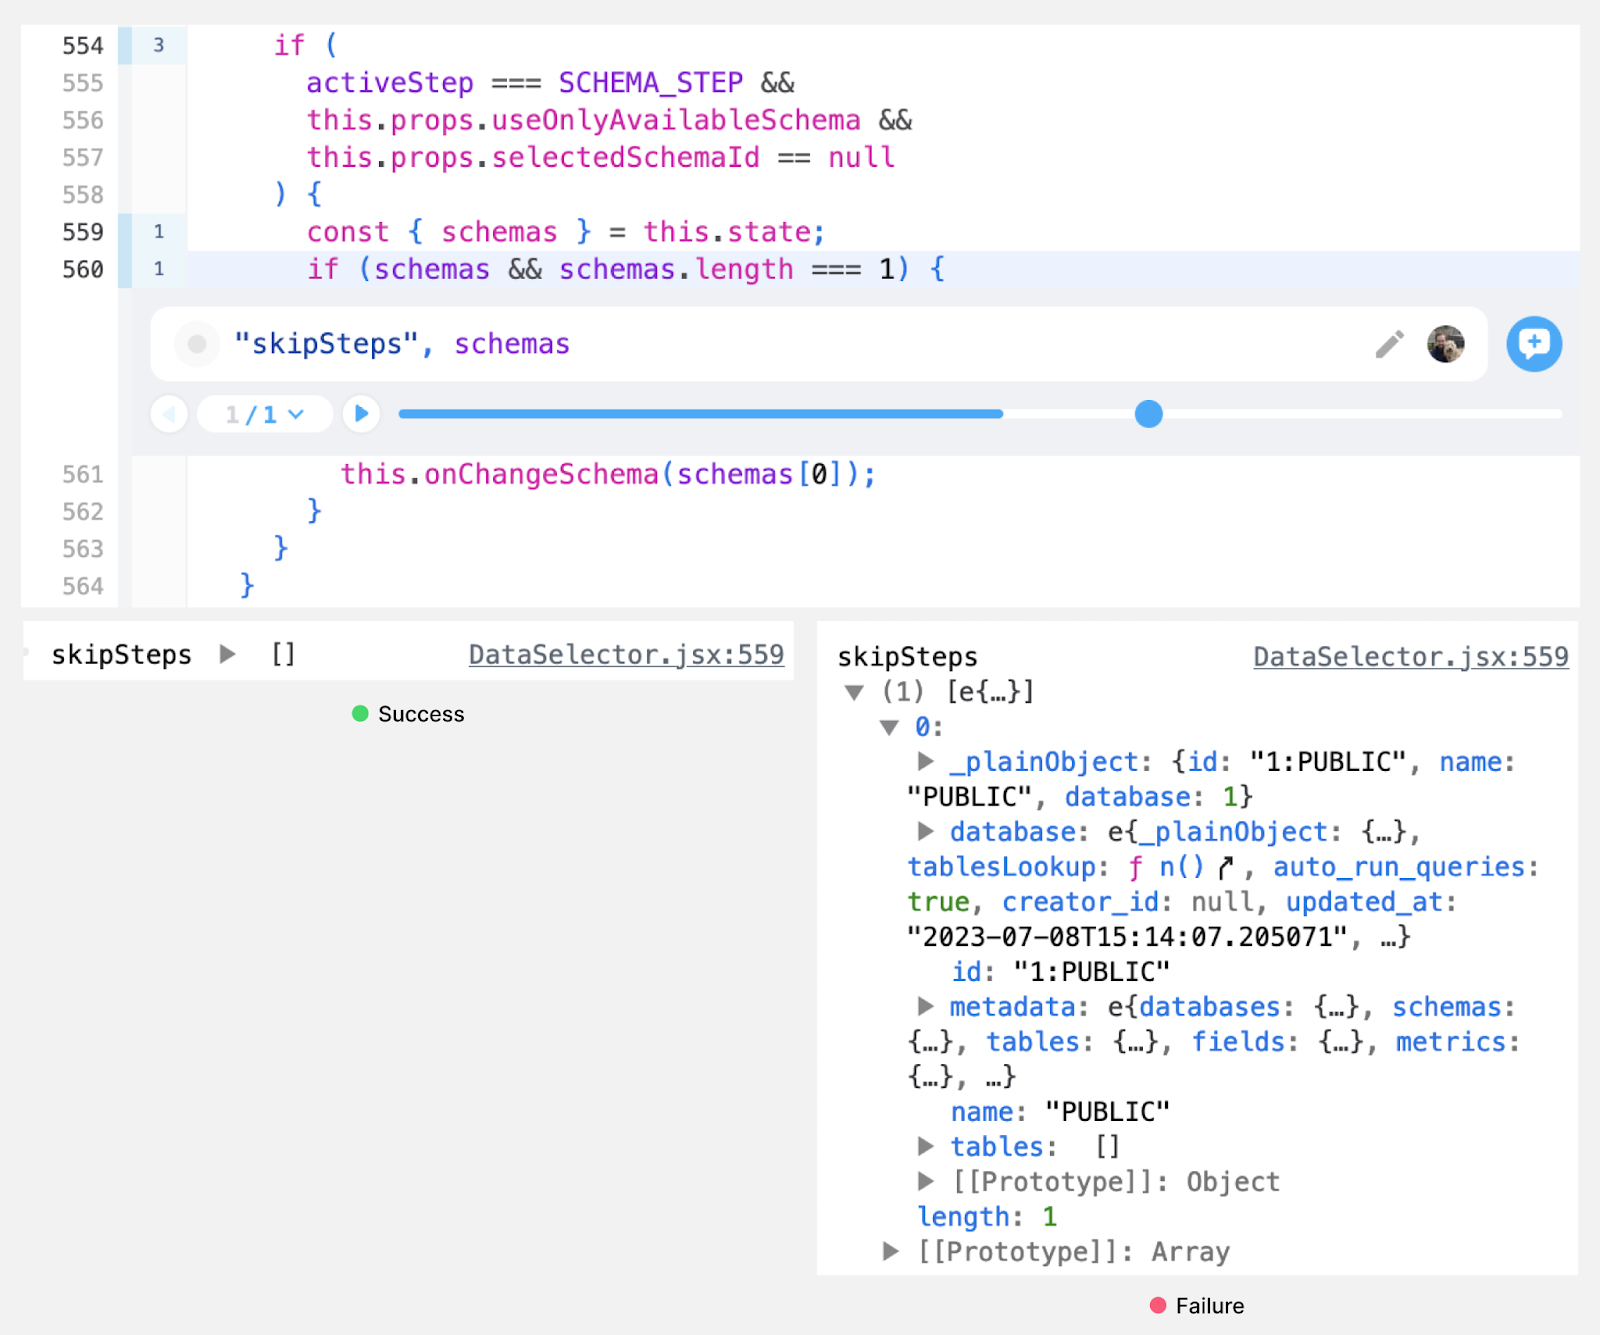
In the successful run the
schemas array is empty, and in the failed run it has a single element with an id of “1:PUBLIC”. The different contents of this array are what appears to lead to the later failure. This array comes from the object’s this.state.schemas so we need to find where that state was set.Step 5: Different contents in this.state.schemas
Looking through the source for the object with different contents for
this.state.schemas, the schemas appear to be set in the setStateWithComputedState function. We can add a print statement at this call to see what the schemas are each time this is called.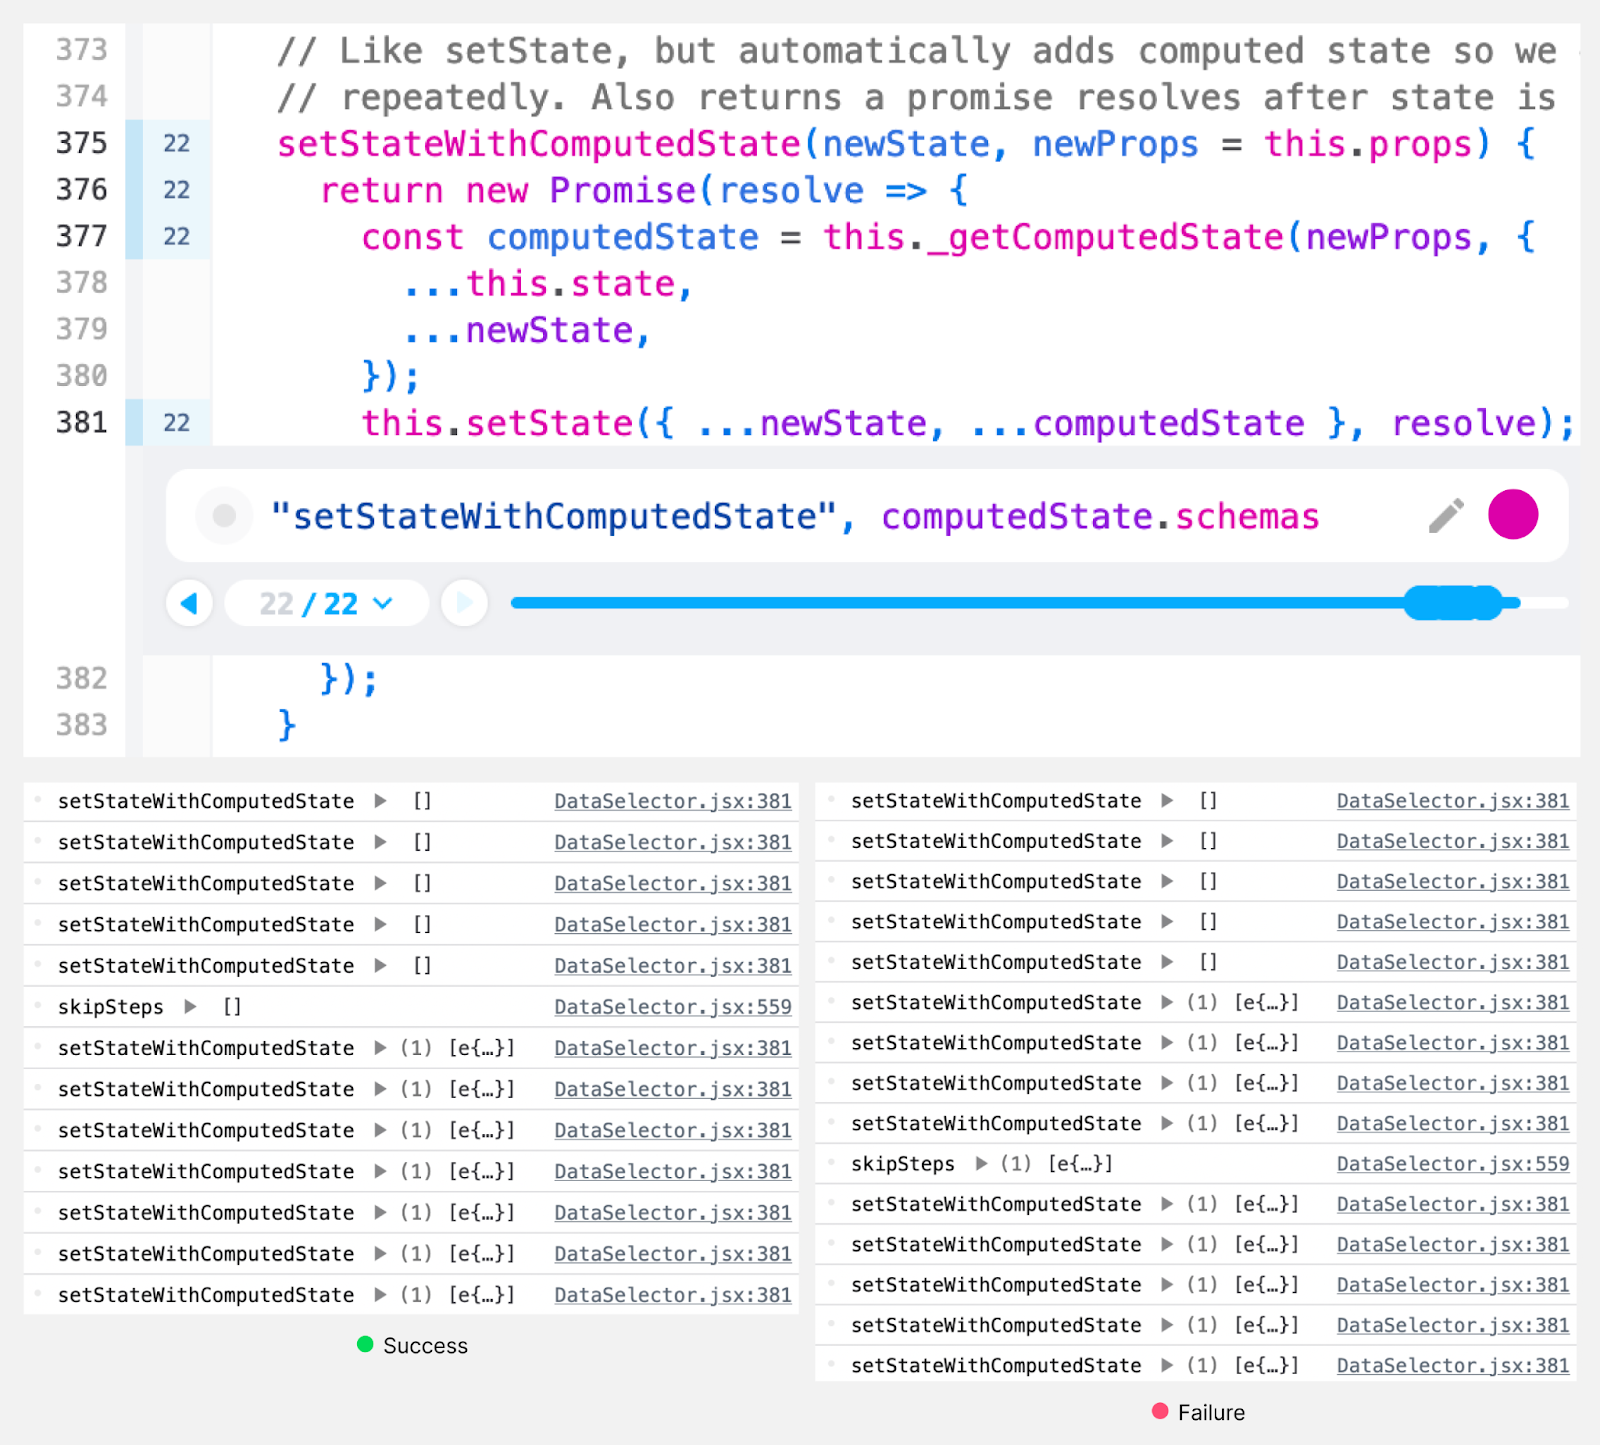
In both the failed run and the successful run, this function is called repeatedly, with early values having an empty
schemas array and later calls having a single element with the “1:PUBLIC” id.The difference between the failed run and the successful run is that in the successful run, the
skipSteps function we identified in step 4 is called before the first point where setStateWithComputedState is called with a non-empty schemas array. In the failed run, the order of these two calls is reversed, so that skipSteps sees a non-empty schemas array, calls onChangeSchema, and follows the remaining steps to the test failure.Because the same operations are happening in both the failed and successful runs, but the order of those operations is different, the cause of the test failure appears to be a race, which would explain why the failure is so timing sensitive. Let’s try to learn more about the circumstances of the race – one (or both!) of the racing calls may be happening at an unpredictable time.
Step 6: Racing calls to skipSteps and setStateWithComputedState with non-empty schemas
When
skipSteps is called we can see the immediate caller in switchToStep and that switchToStep was called via componentDidMount on an associated react component. This will probably happen at about the same point between test runs, let’s look at setStateWithComputedState instead.setStateWithComputedState gets the schemas from a call to this._getComputedState, which in turn gets those schemas from a call to setSelectedDatabase, which reads them from a property database.schemas. Let’s set a print statement when this property is read.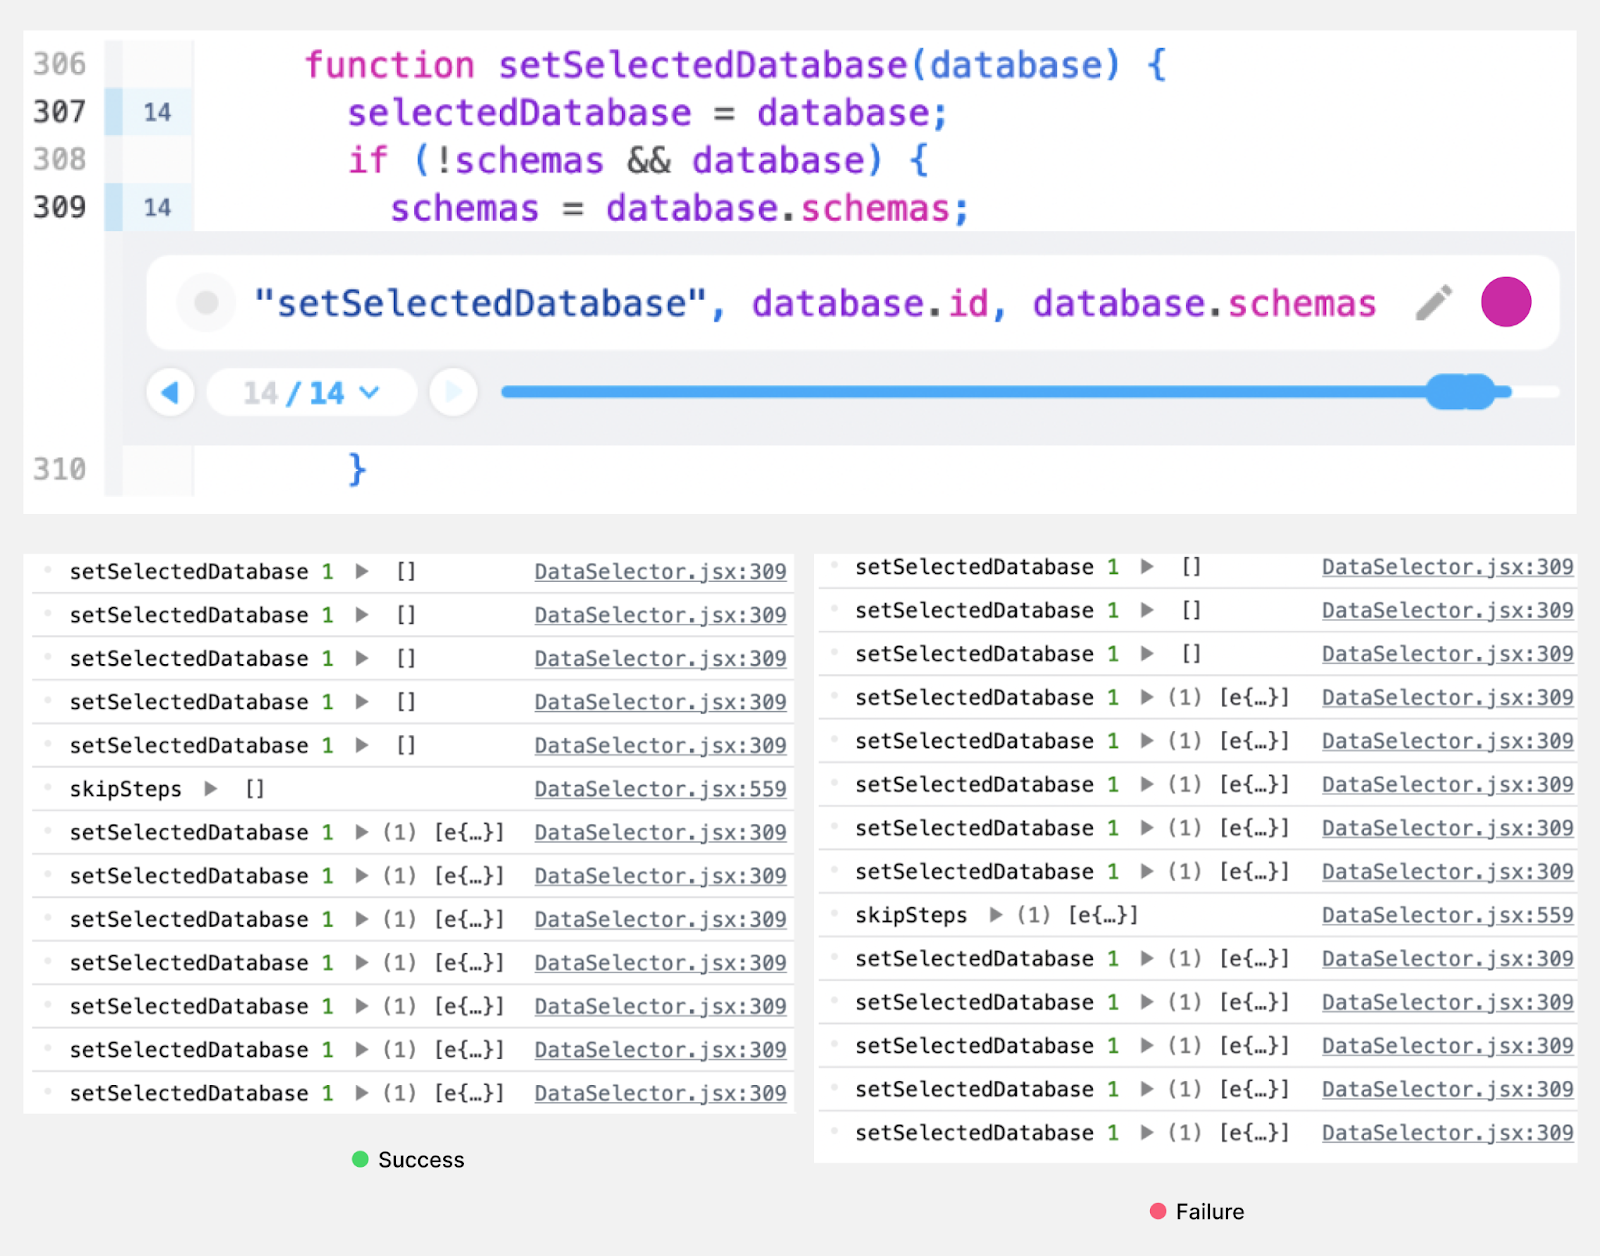
This print statement shows a similar pattern to what we saw in step 5: there are many times this property is read in both the successful and failed runs, and in both cases the schemas are initially empty but become non-empty at different points in the test run. The database id never varies between the successful and failed runs, so the point at which the schemas of that database are filled in seems to be unpredictable.
Step 7: Unpredictable updates to database.schemas
The databases in this component come from state managed by
databases.js, and the schemas for those databases in turn come from state managed by schemas.js. If we set a print statement in the list function in this file, we can see that the schemas were fetched in both the successful and failed runs. The schemas are fetched asynchronously via a database query, and we can also set a print statement at the end of this list function to see when the query finished.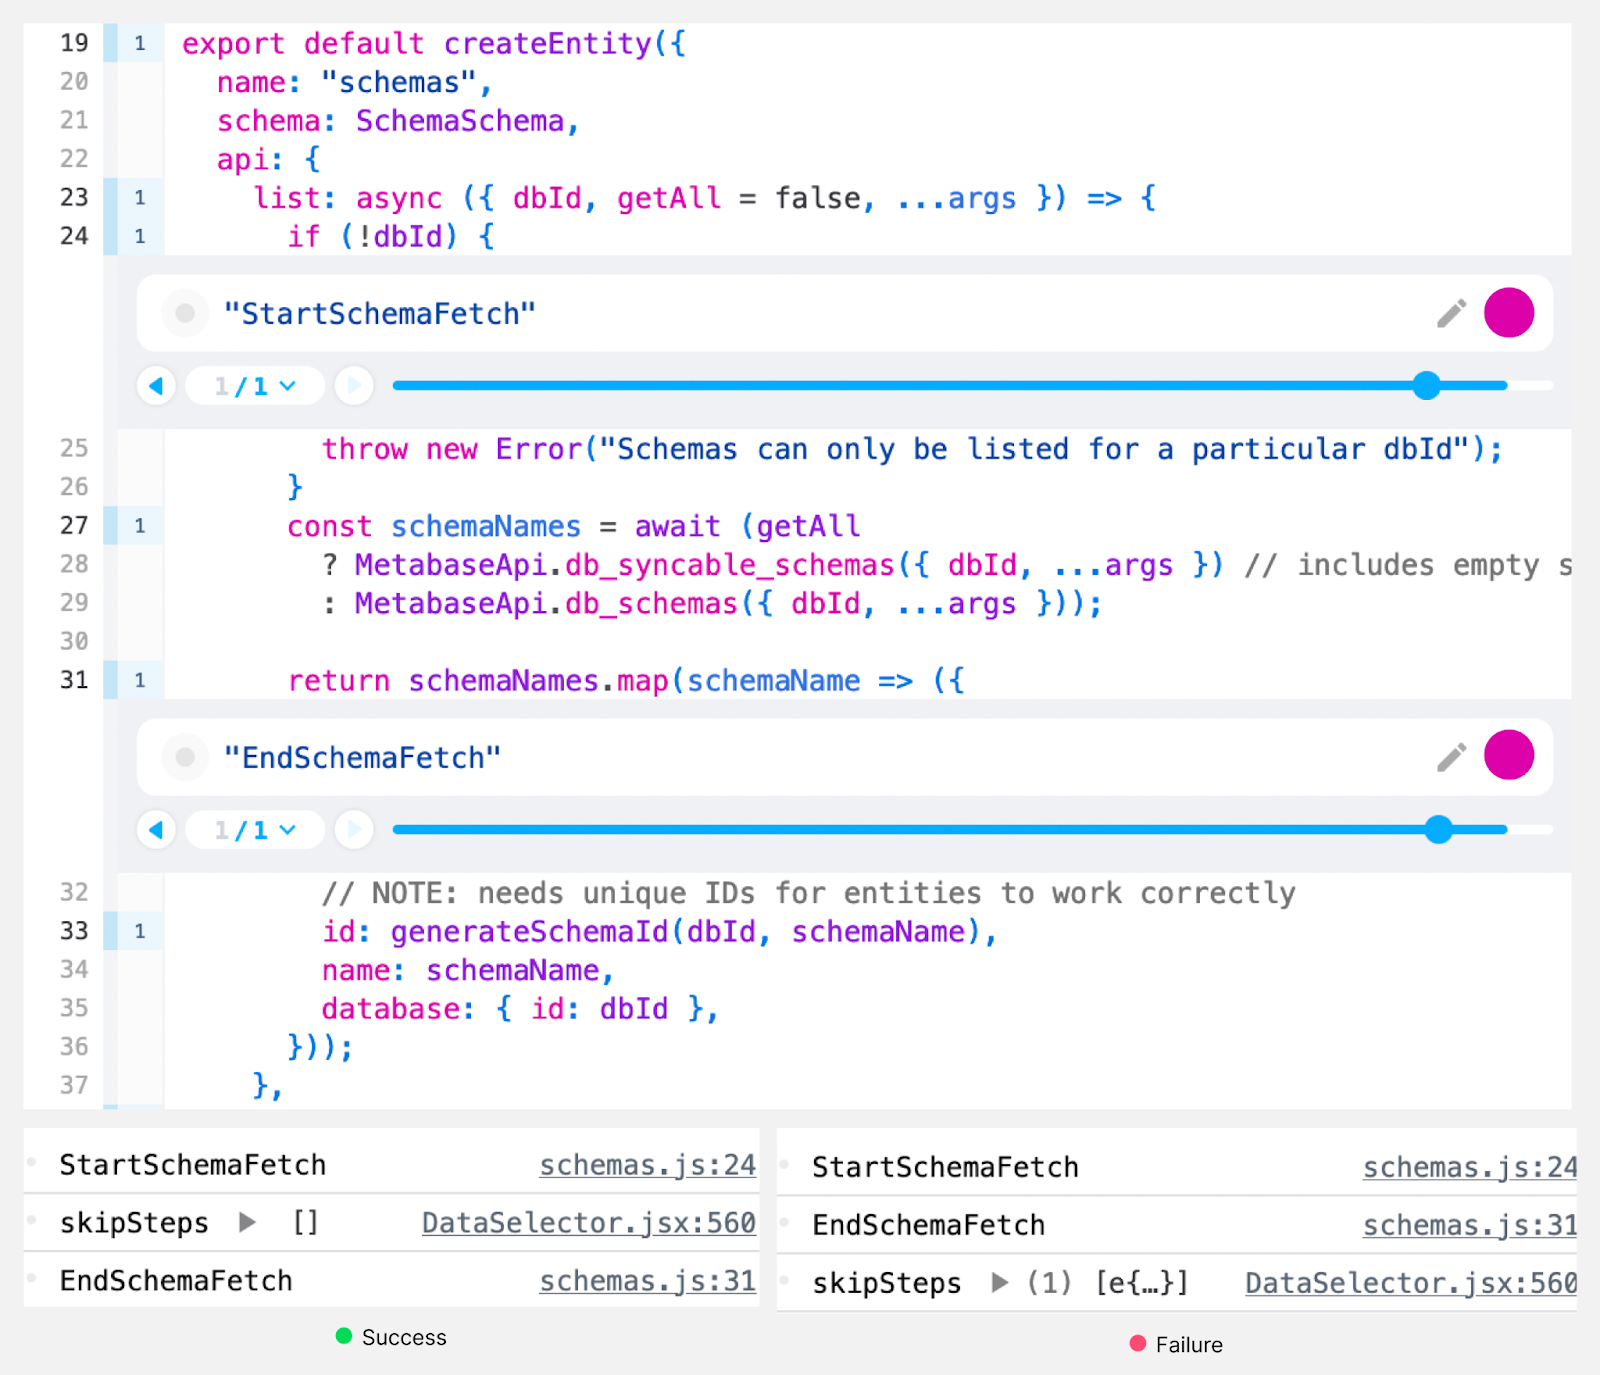
In both the successful and failed runs, the schemas started to be fetched at what looks like roughly the same point, before the
skipSteps call we identified in step 4. In the successful run the fetch did not finish until after the skipSteps call, and in the failed run the fetch finished before the skipSteps call.This appears to be the root cause of the test failure:
There is a race between the React component associated with the
skipSteps call being mounted, and the database query to get the schemas finishing. We found the bug! Now that we've found the root cause, fixing the problem should be relatively straightforward.
Conclusion
Having a replay of this test failure was enough for us to debug it and identify the race condition causing the failure, by tracing the problem directly back to its source. Figuring this out in any other way would have been extraordinarily difficult.
We would love to help you understand and fix your test failures. If you’d like to get started, go to https://docs.replay.io/test-suites. Replay is free for open source projects and inexpensive for other uses, see https://www.replay.io/pricing for details. Debugging test failures should be fun and easy, not a nightmare. All it takes is one replay to find the problem!