

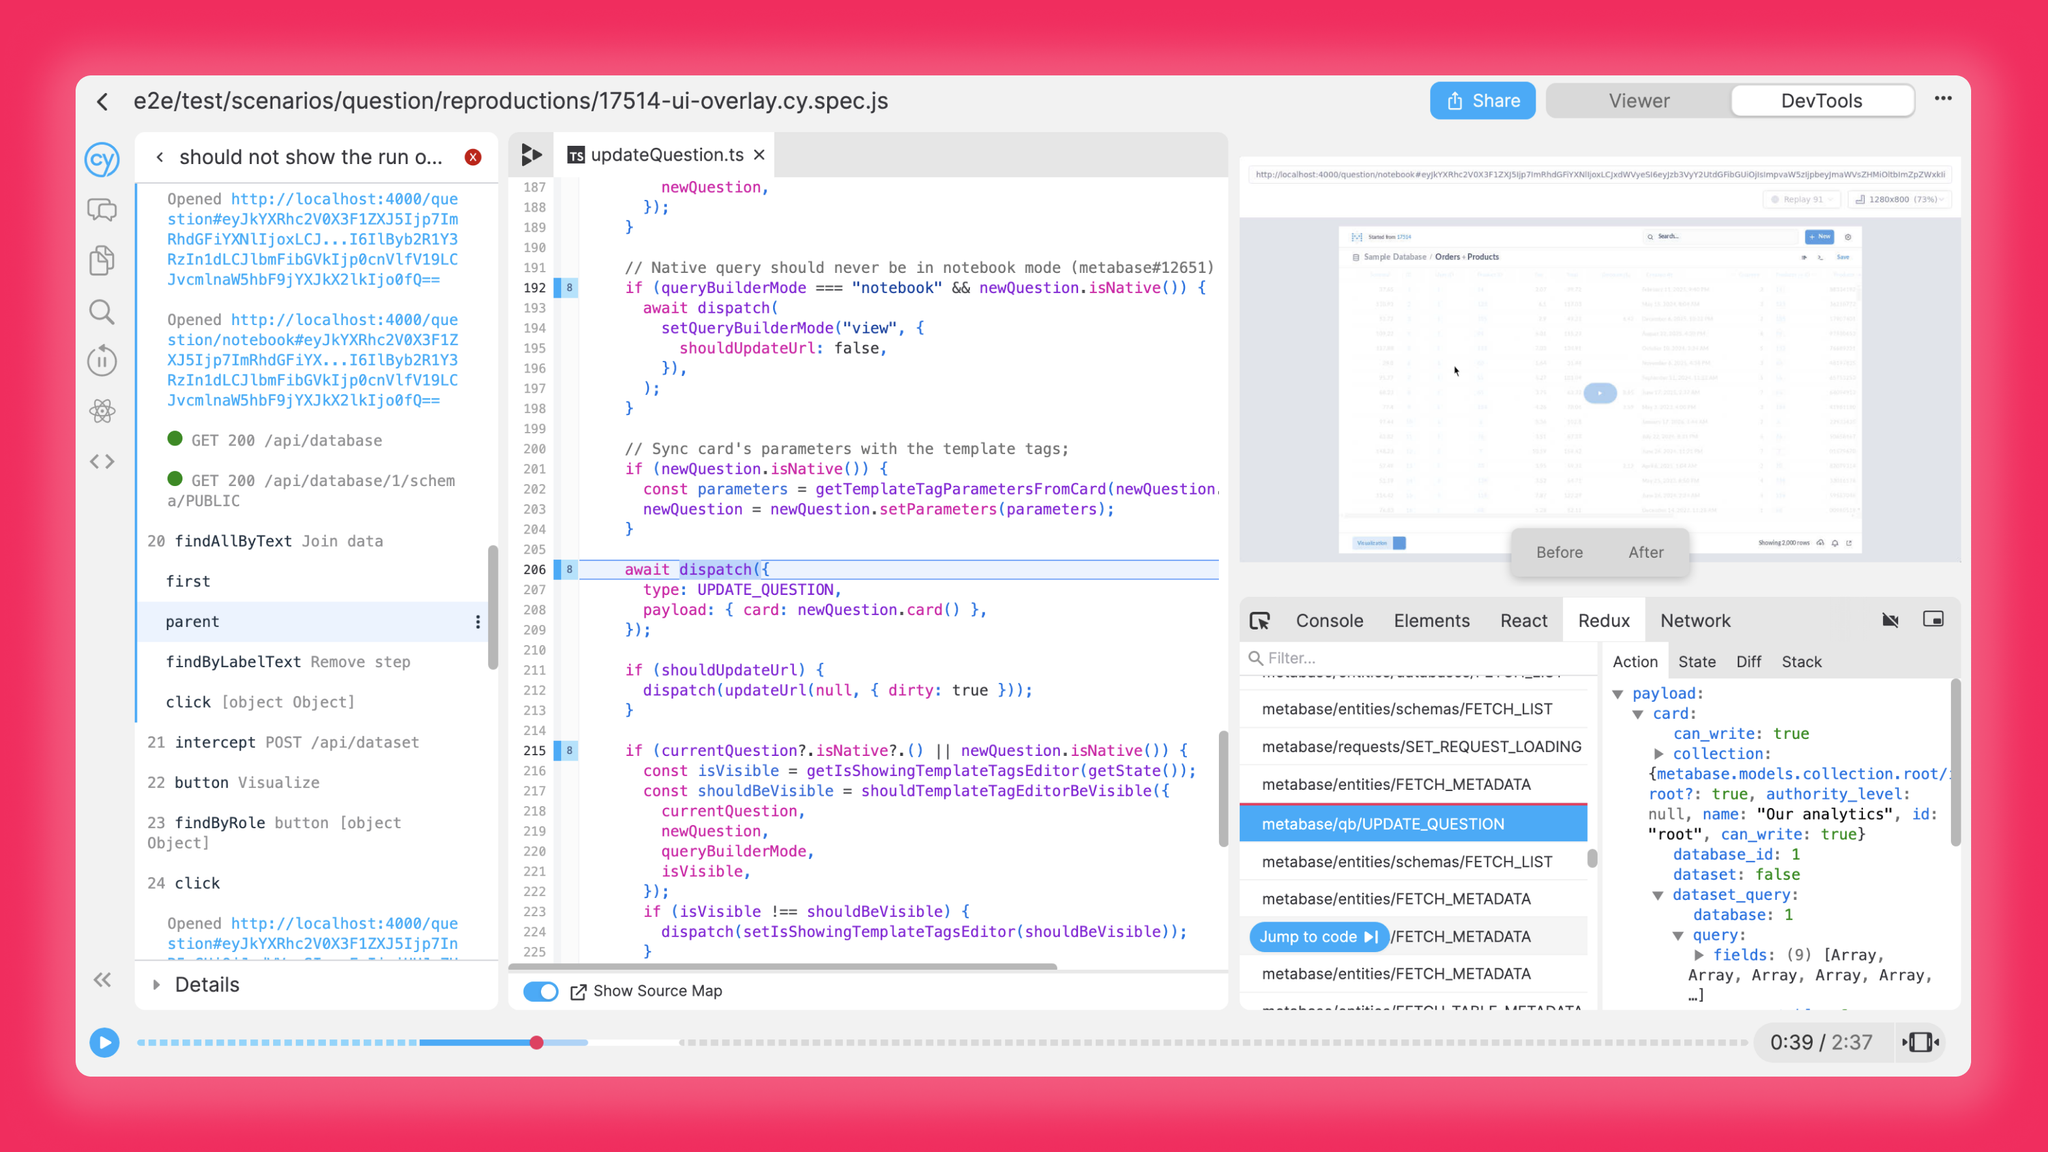
We’re excited to share a beta version of Redux DevTools! If you open a Chrome replay, you’ll see the Redux tab in the bottom right.
Redux DevTools in Replay has everything you’ve come to expect. You can view the list of actions, see an action payload, view your application state over time, and even see the diff. We’ve also added our Jump to Code button so that you can jump to each action’s dispatch. And unlike standard Redux DevTools, there are no gotchas on what you include in the action payload or how you define your reducers work. If your application runs, you can replay it in Redux DevTools. Lastly, because Redux DevTools was designed to let other state management libraries connect as well, it works out of the box with libraries like Zustand, Jotai, and NgRx.
On a personal level, adding Redux DevTools means a lot for the team. When Dan Abramov first introduced Redux in 2015, Redux’s initial goal was to bring time travel debugging to React apps. The magic of time travel in Redux played a large role in inspiring us to bring time travel to JS. With Redux maintainer Mark Erikson on the team, we are personally invested in making Redux as debuggable and understandable as possible, and fulfilling the vision of understanding and debugging app behavior through time travel.
Debugging a Flaky Test with Replay
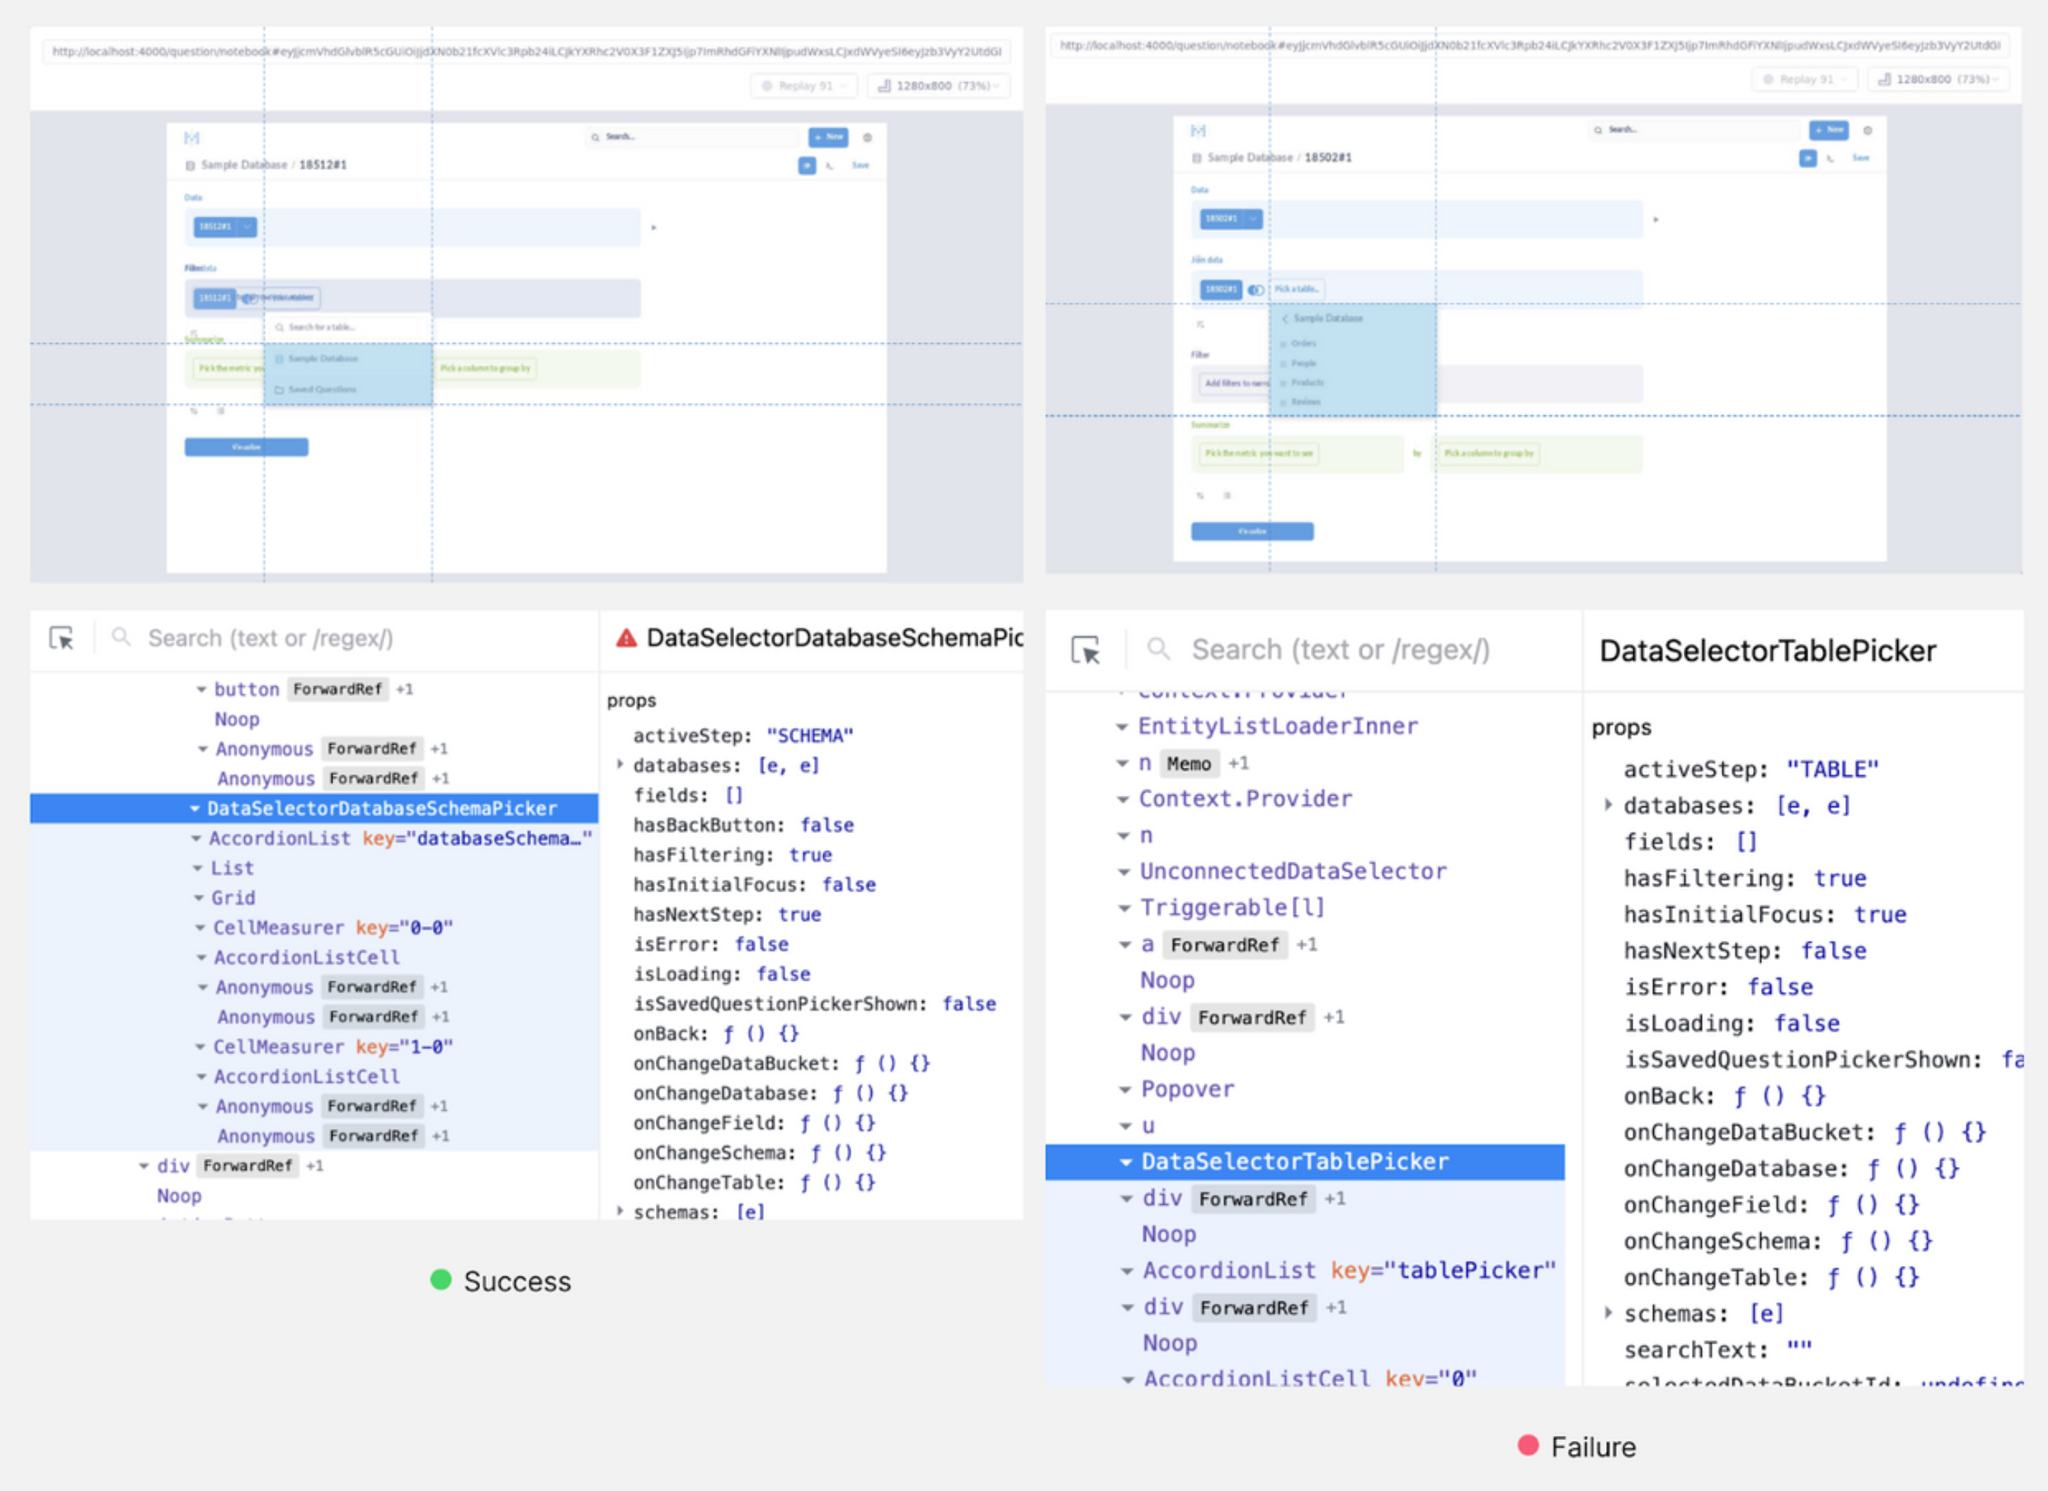
We published a post on how we debugged a particularly difficult Metabase flake with React DevTools and retroactive print statements. A common misconception is that flakes are a testing problem, but we’ve found that most of the time, flakes are an application problem, and improving your application helps your tests and your users.
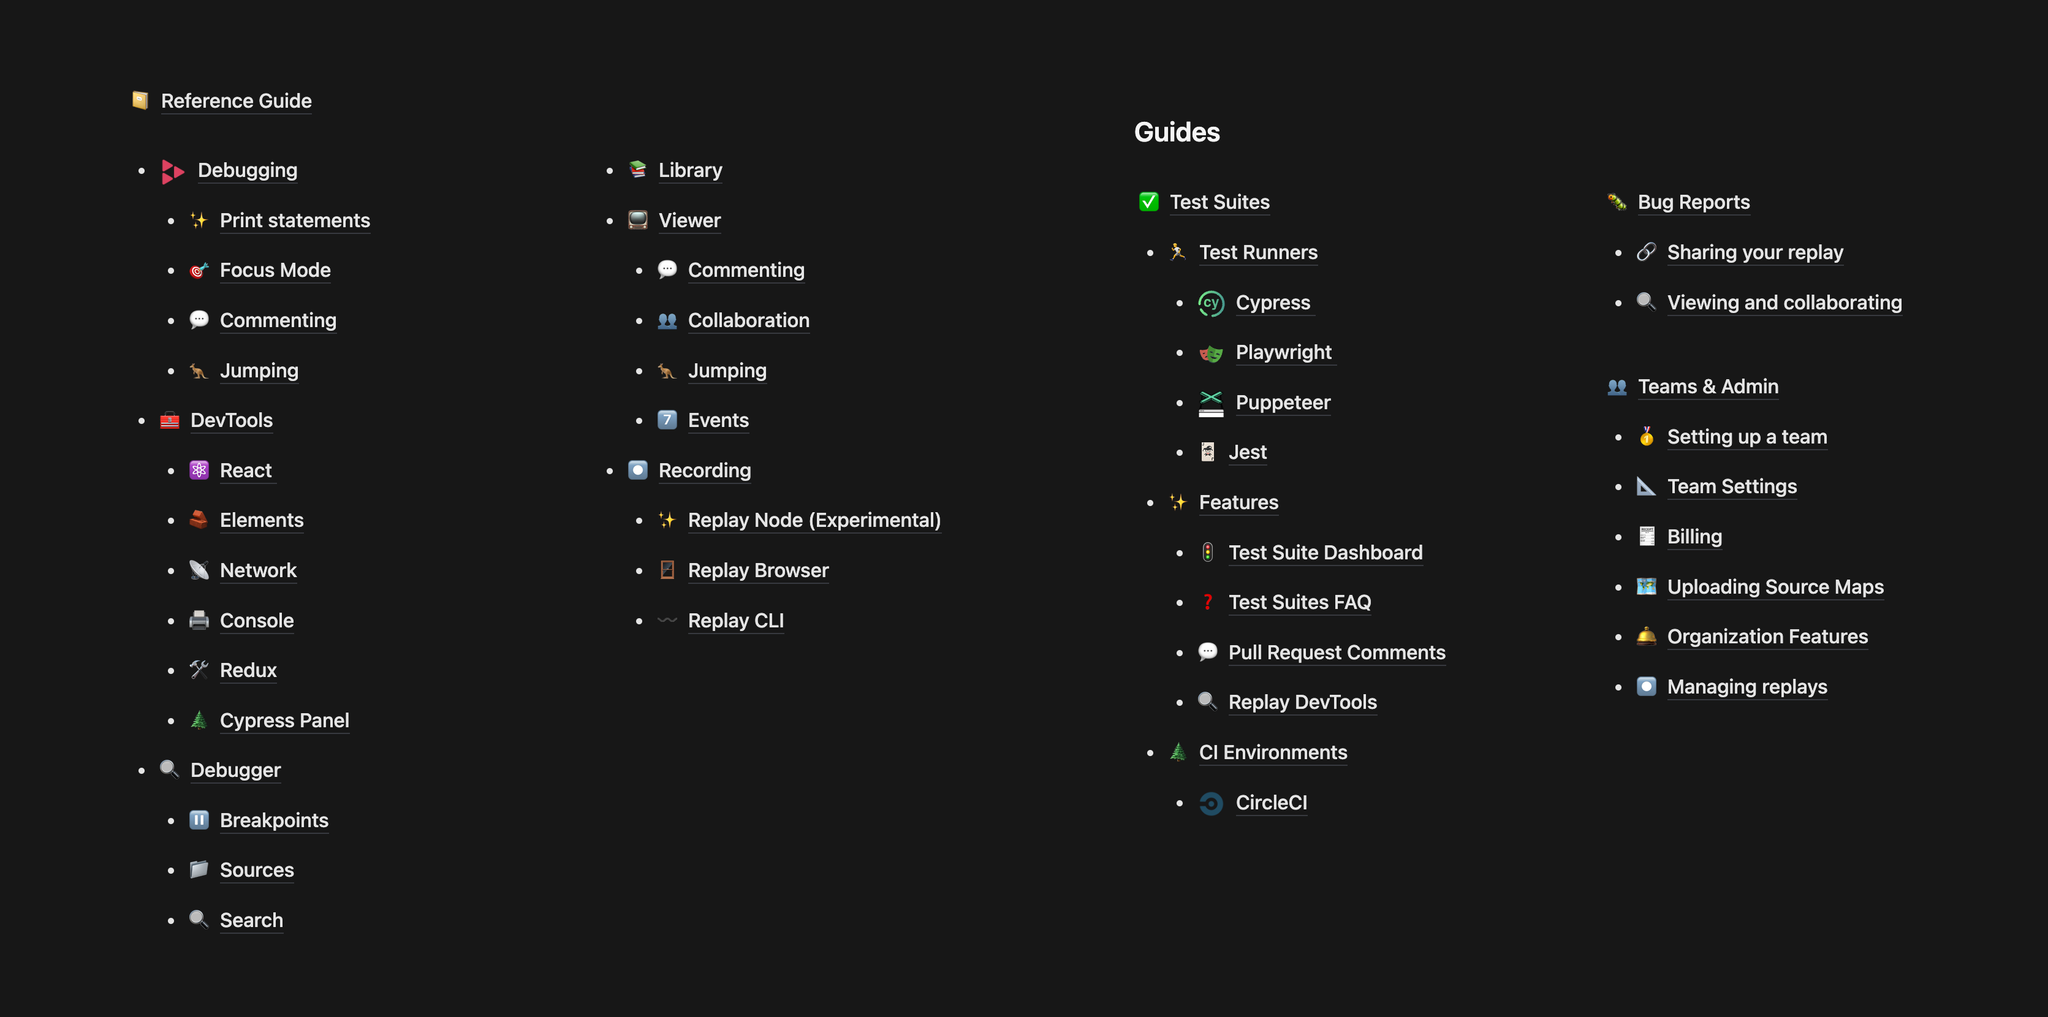
Improved Documentation
We’ve improved our documentation over the past two weeks with three goals. First, we want to make it easier to understand what time travel debugging is and have resources for sharing with your team members. Second, we want to make it easier to learn how to use Replay DevTools to inspect your apps. And third, we want to make it easier to start recording your browser tests regardless of whether you’re using Cypress, Playwright, Puppeteer, or Selenium.
React DevTools Reliability
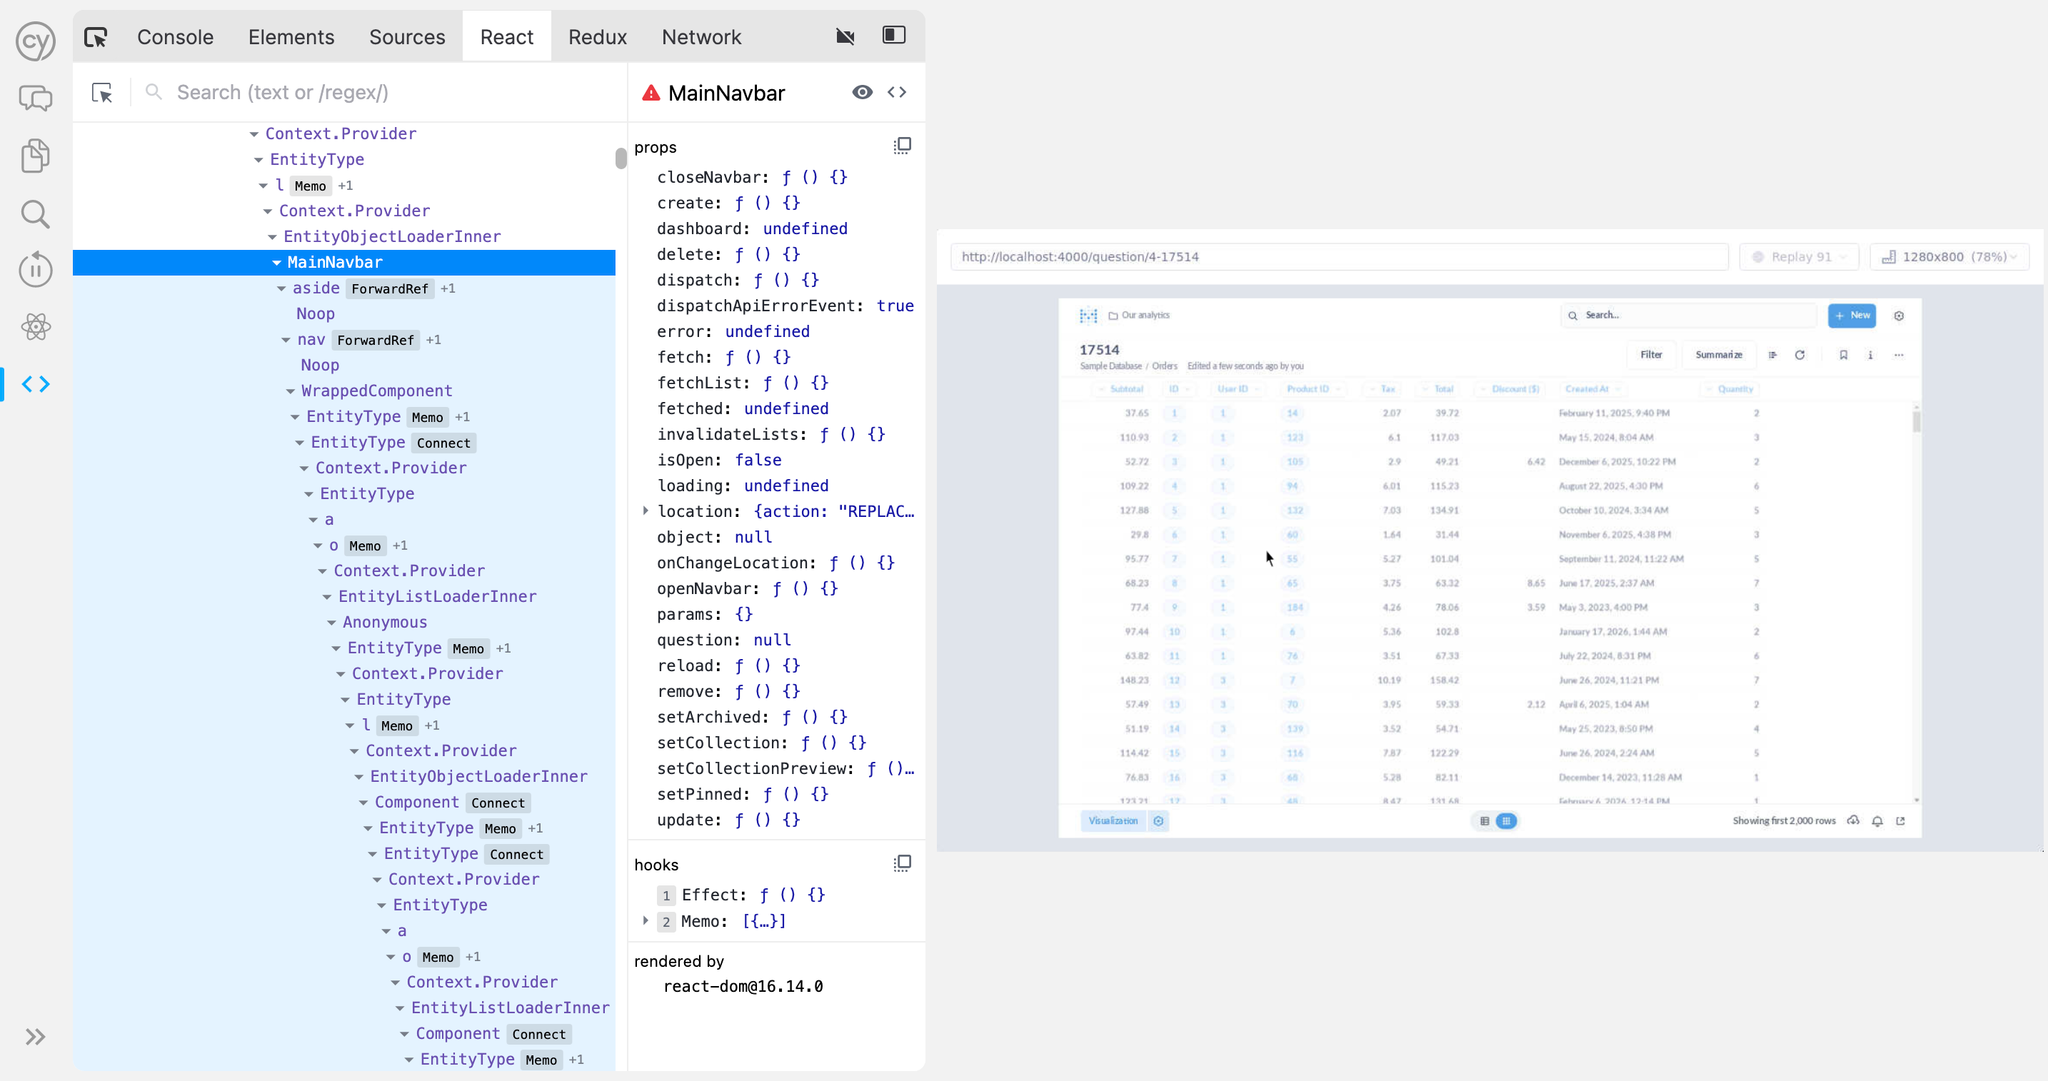
Two weeks ago we shared that we had added additional asserts inside React DevTools to ensure that you could trust the data it was showing. As a result though, React DevTools was no longer available for a significant number of recordings.
Today we are excited to share that we’ve fixed nearly all of the cases and React DevTools is now available significantly more often.
Improved Graphics
One of the most important features of time travel debugging is that you see the correct graphics at each execution point. On the surface, the video you see in Replay DevTools and Session Replay tools are similar. However, Session Replay videos are typically only 30 frames per second, while Replay computes graphics on demand so in theory the video could be millions of frames per second.
On-demand paints can be the difference between pausing in a React render and seeing why your Playwright or Cypress flake occurred, or continuing to hunt in the dark. This week, we made several important changes to the paint JPEGs we compute and the fidelity when it comes to scroll events.