
The future of developer tooling is in AI. Software is increasingly being built by people working with AIs, whether assistants or async agents. Just like people, AIs need good devtools to be most effective, and AI based devtools can give people a clear understanding of their software that just isn’t possible otherwise.
The Nut API is a chat interface for explaining what happened in a recorded execution of an application. Nut uses Replay recordings, which capture all of the billions of things that happen while an application runs, and Nut has complete access to this information for answering questions precisely. We’re building Nut to make it faster and easier to develop software, in particular by giving code writing AIs the best context for making changes and fixing bugs.
Recordings used by Nut can be made using either the Replay browser or simulation. The browser is a drop in Chrome replacement that records applications with perfect fidelity. Simulation is a bit lower fidelity (timing sensitive bugs might not reproduce) but can be used in any execution environment with a stock browser.
The first tool using the Nut API is Nut.new (blog post), which is a Bolt.new integration for building applications with natural language. Bolt and similar no-code tools (V0, Lovable, Replit) are amazing and show the future of how most software will be built, but have a common problem in that they frequently get stuck on bugs or changes the AI can’t figure out, leaving non-developers with little recourse.
Examples
Let’s look at a few examples using Nut to crack problems that Bolt got stuck on. In each case the AI which Bolt uses can’t figure out what to do, but it is only looking at the source code. These problems would also be hard for a person to fix just from the code, but a person can use devtools to figure things out pretty quickly. When we use Nut as devtools for the AI, it figures things out too.
The first problem, which you can try yourself, is the same one we looked at in the launch blog post. We’re building an app to get printable directions between two cities, but it goes blank instead of showing directions. Nut.new sends the simulation data to the Nut API for creating a recording, and then a message with the user’s prompt and some system level instructions:
javascript[
  {
    "role": "system",
    "type": "text",
    "content": "\nThe following user message describes a bug or other problem on the page which needs to be fixed.\nYou must respond with a useful explanation that will help the user understand the source of the problem.\nDo not describe the specific fix needed.\n"
  },
  {
    "role": "user",
    "type": "text",
    "content": "app goes blank getting directions"
  }
]
Nut comes back with an accurate explanation of why the screen went blank:
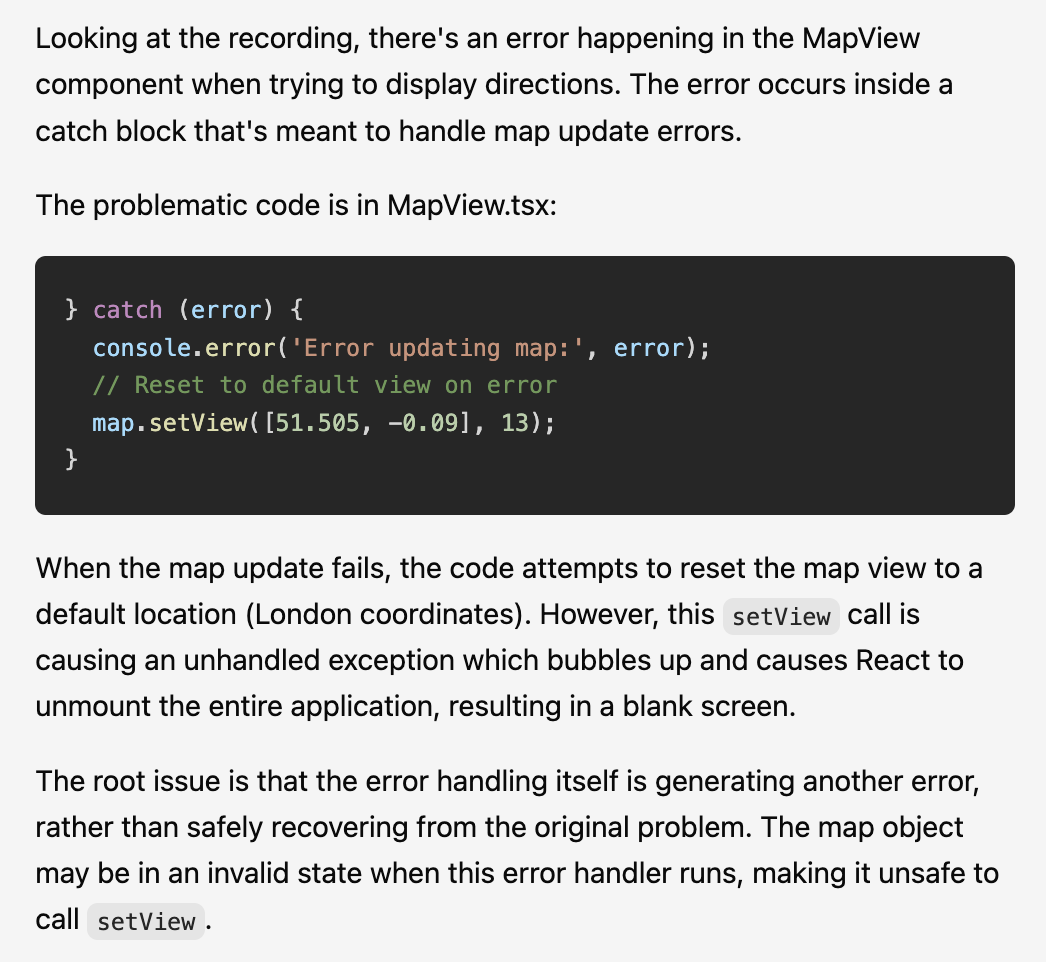
This explanation gives the AI the context it needs to write an appropriate fix.
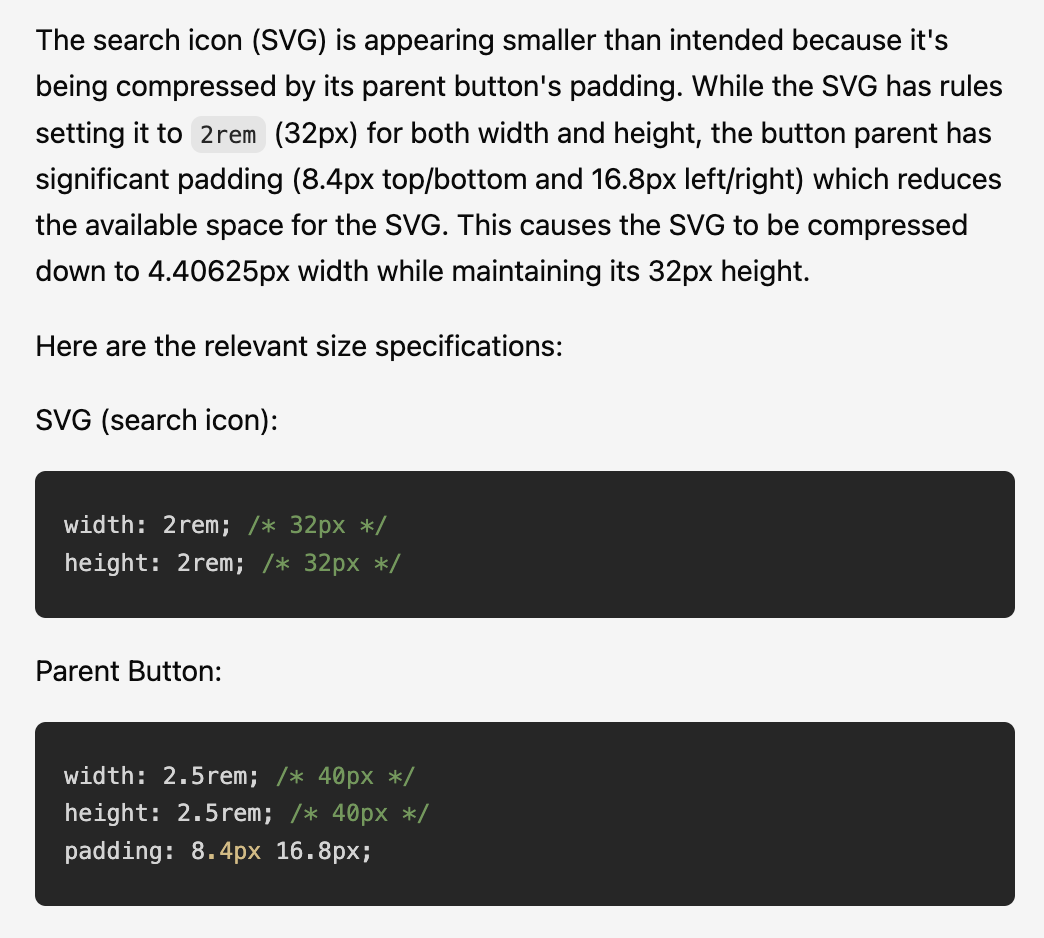
The next problem is a styling issue: a search icon on a button is really tiny, and Bolt’s AI couldn’t figure out how to make it bigger. We marked the search icon in the UI and then messaged Nut. The system instructions use an XML tag to describe the marked element.
javascript[
  {
    "role": "system",
    "type": "text",
    "content": "\nThe following user message describes a bug or other problem on the page which needs to be fixed.\nYou must respond with a useful explanation that will help the user understand the source of the problem.\nDo not describe the specific fix needed.\nThe user pointed to an element on the page <element selector=\"#root > div > div:nth-child(1) > div:nth-child(2) > button > svg\" height=31.99652862548828 width=5.295139312744141 x=2.4357147216796875 y=18.300331115722656 />"
  },
  {
    "role": "user",
    "type": "text",
    "content": "the search icon is too small, it should be 20px by 20px"
  }
]
Nut then came back with an accurate explanation. This is usually enough for the AI to produce the correct fix. Sometimes the AI gets it wrong and needs to be prodded again, but it won’t get stuck.
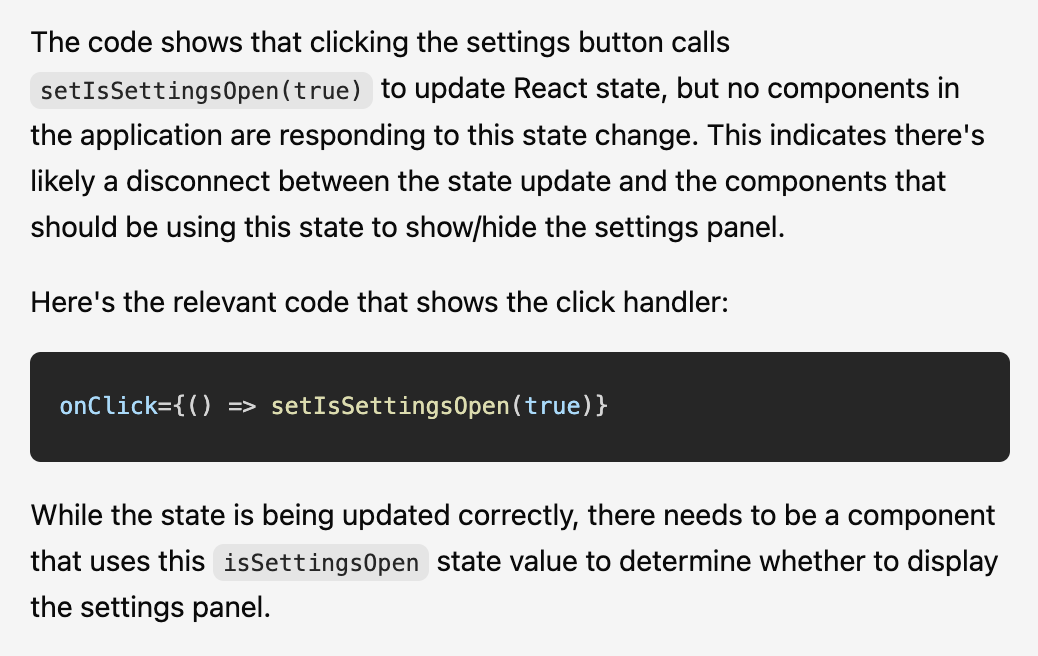
The last problem is with a button to open a settings page that doesn’t work. This seems like a simple thing but Bolt’s AI couldn’t fix it — the problem is a bit subtle in that the settings modal is rendered on some paths but not all. We similarly marked the button and gave Nut a simple prompt and got back a suitable explanation which again is usually enough for the AI to fix the underlying problem.
In each of these problems, the extra context which Nut provides through its explanation is key to the AI’s ability to produce a fix. This context isn’t apparent from the source: an understanding of the runtime behavior of the application is needed for these fixes. Wading through the logs and other information which traditional devtools provide is an alternative way to get this context, but the concise explanations from Nut are ideal, for AIs as well as people.
What’s Next
Things are still pretty early with Nut and it’s only good at explaining problems similar to what it’s seen before. Our main focus is on building out the set of problems which we want Nut to solve and getting it good at solving them.
Beyond this, as with other chat APIs Nut is extremely versatile and we’re excited to explore using it to help with software development in other ways:
- AI agents working on fixes in larger code bases, where proper context is essential.
- Adding chat to our devtools to provide assistance to all our users.
- Validating fixes by simulating the original interactions with the fix applied and precisely describing how the app’s behavior has changed.
- Identifying performance problems and the reasons why tests are failing.
If you’re interested in trying out the Nut API or using it in your own products, we’d love to hear from you. Reach us at hi@replay.io or fill out our contact form and we’ll be in touch.