Before jumping in, we’d like to apologize for the radio silence. Over the past three months we’ve been heads down helping onboard some really large Test Suite teams. In the process, we’ve built an incredible backlog of updates we’re excited to share with all of you. The only thing stopping us, is the rate at which we can share them. So expect more updates from us in the near future!
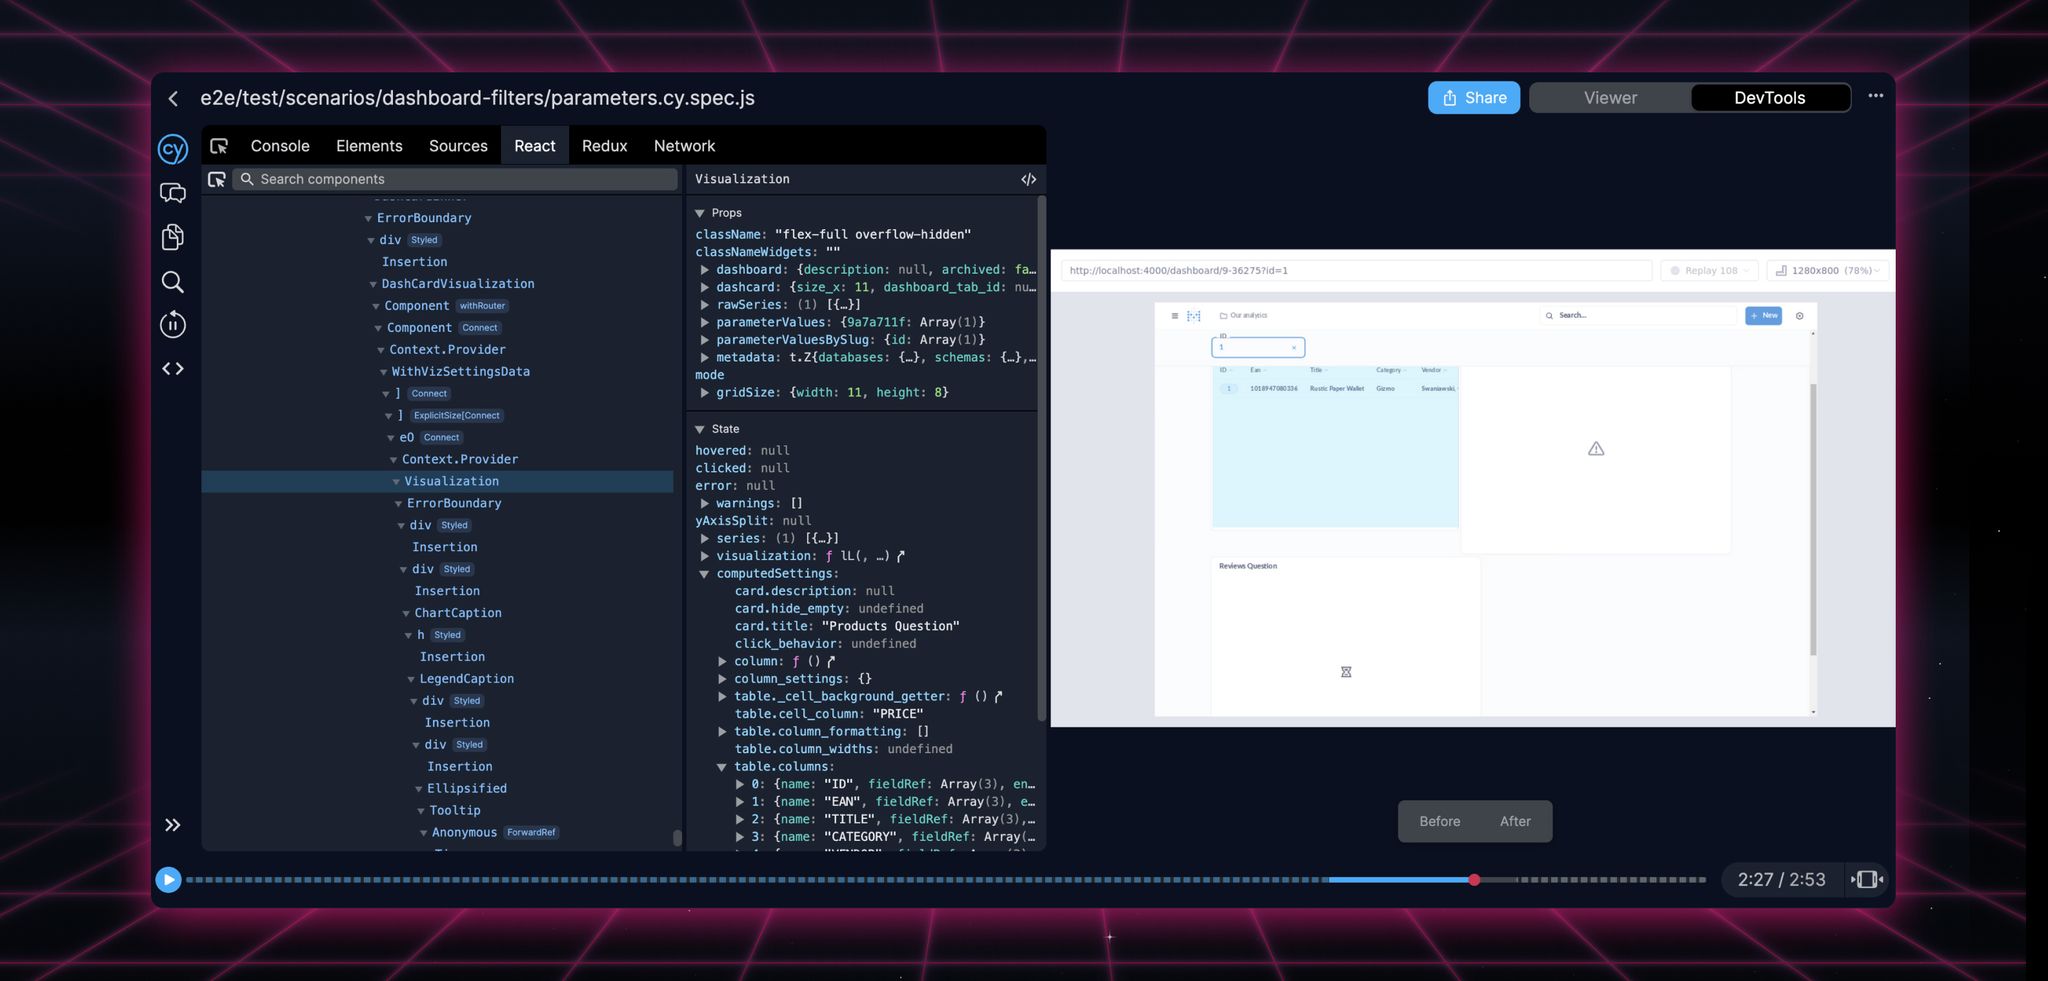
Today we’re excited to share an entirely new version of React DevTools which Brian Vaughn wrote from scratch.
The history of React DevTools at Replay is wild. When we released React DevTools for Firefox two years ago, we reused both React’s content script that runs in the page and React’s frontend that runs in DevTools. The amazing thing was that because it worked, you could inspect your React components in Replay as if the application were running live.
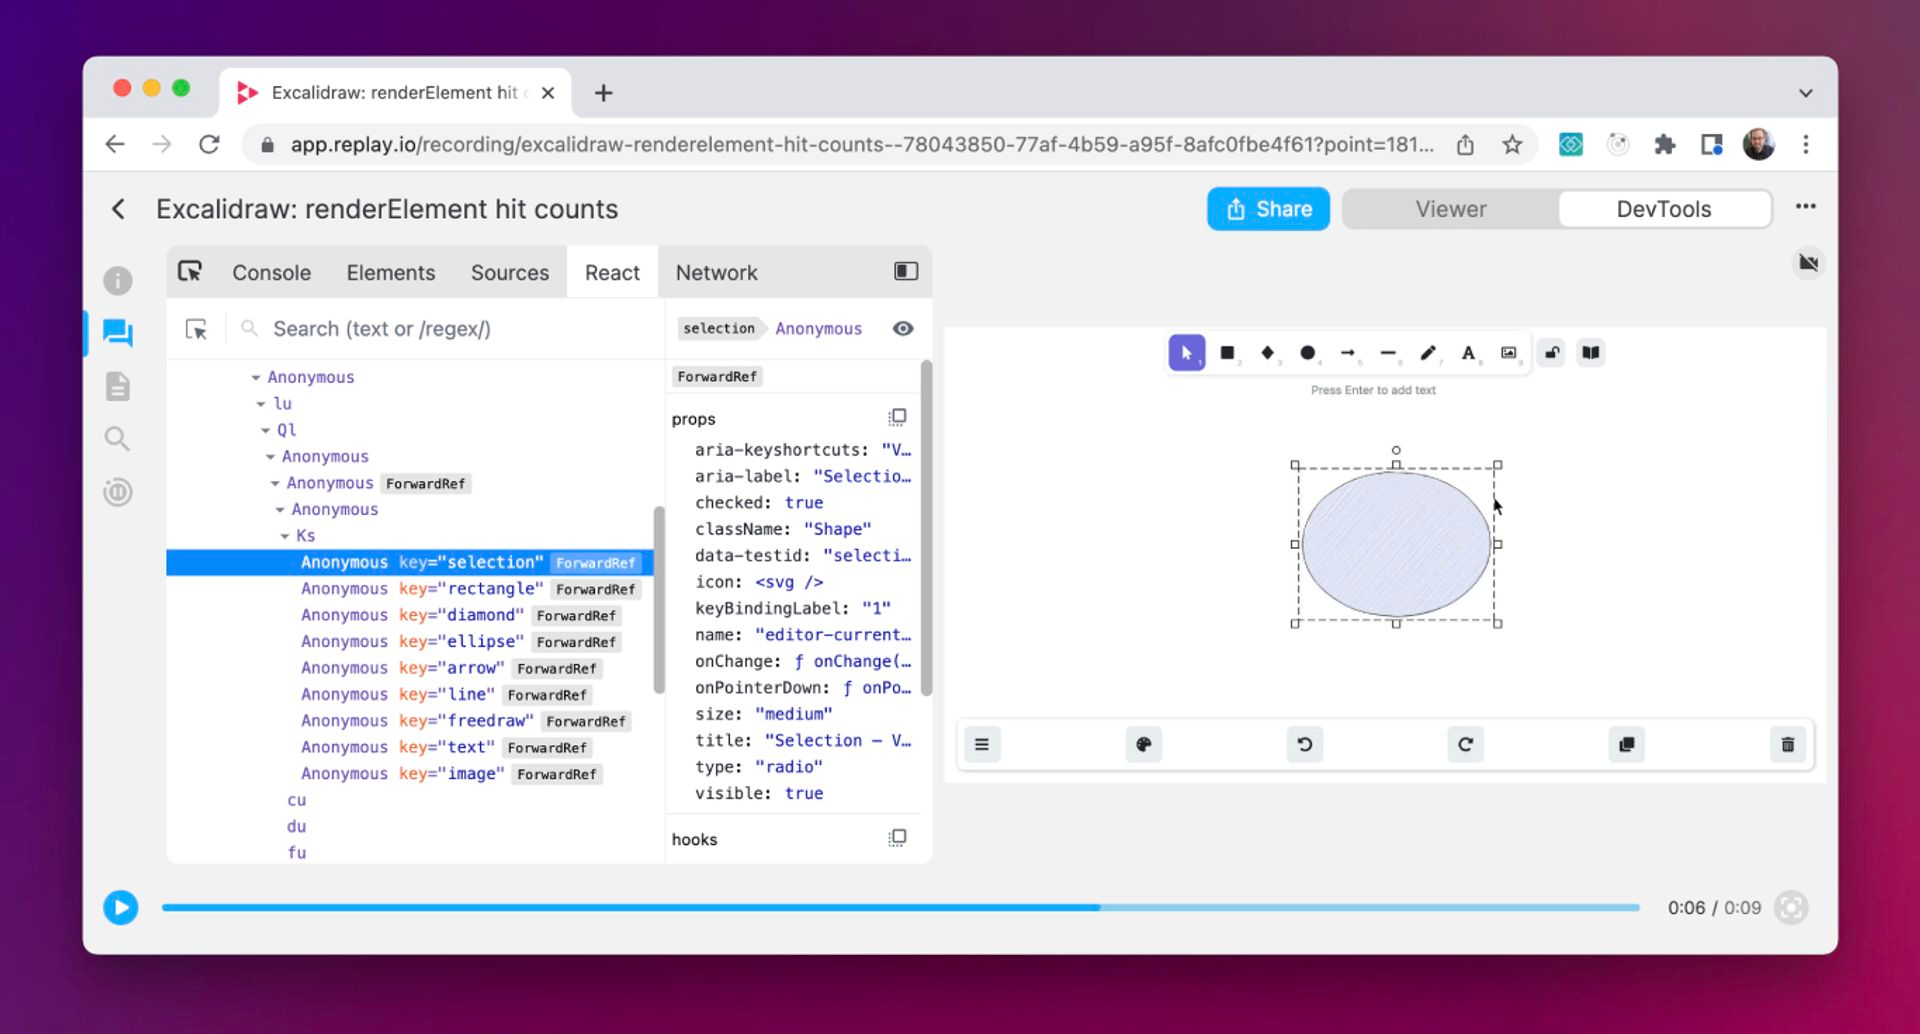
When we released React DevTools for Chrome last year, we re-wrote React’s content script so that we could run it while replaying instead of recording. This was incredible because it’s the first time anyone’s run a new script while replaying and was able to cut 10% off of our recording overhead!
Even more importantly, it meant we could start adding new functionality that’s not possible while the application is running. The best example of this is that we were able to start source mapping component names in production! Say good by to
s, o, h and component name alphabet soup 😂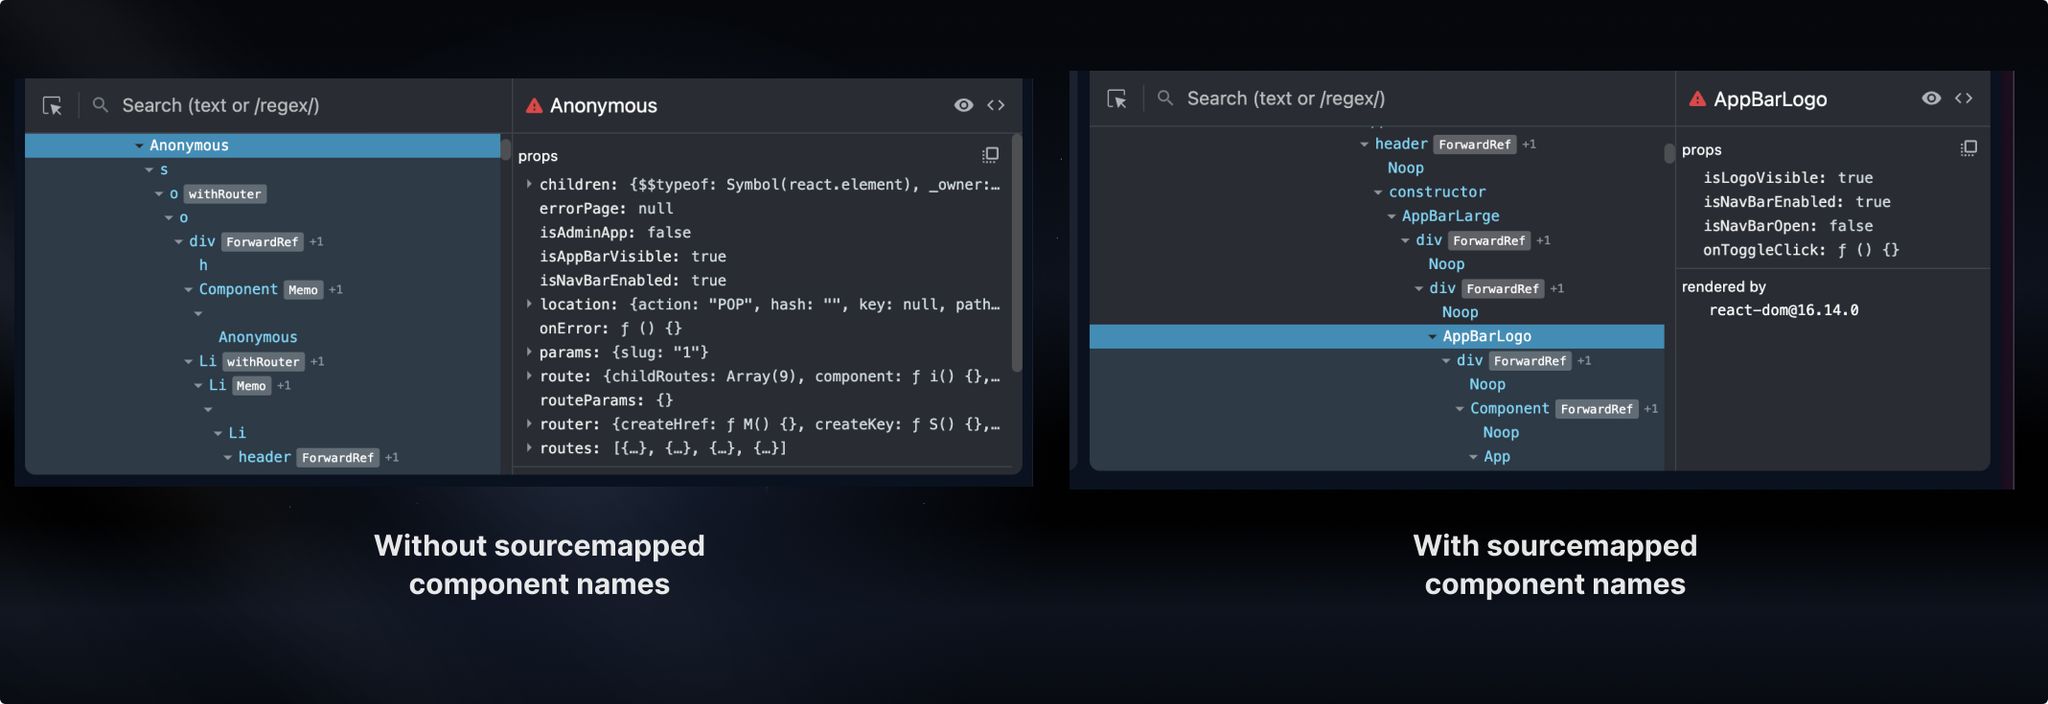
With today’s release we’re taking React DevTools to the next level and introducing an entirely new React DevTools frontend, which lets us add new time travel super powers into the UI. The best example of this is we now highlight the component props and state that changed. We also show the hook names and let you jump to their definitions. And aren’t the object previews so much nicer than the JSON views they replaced!
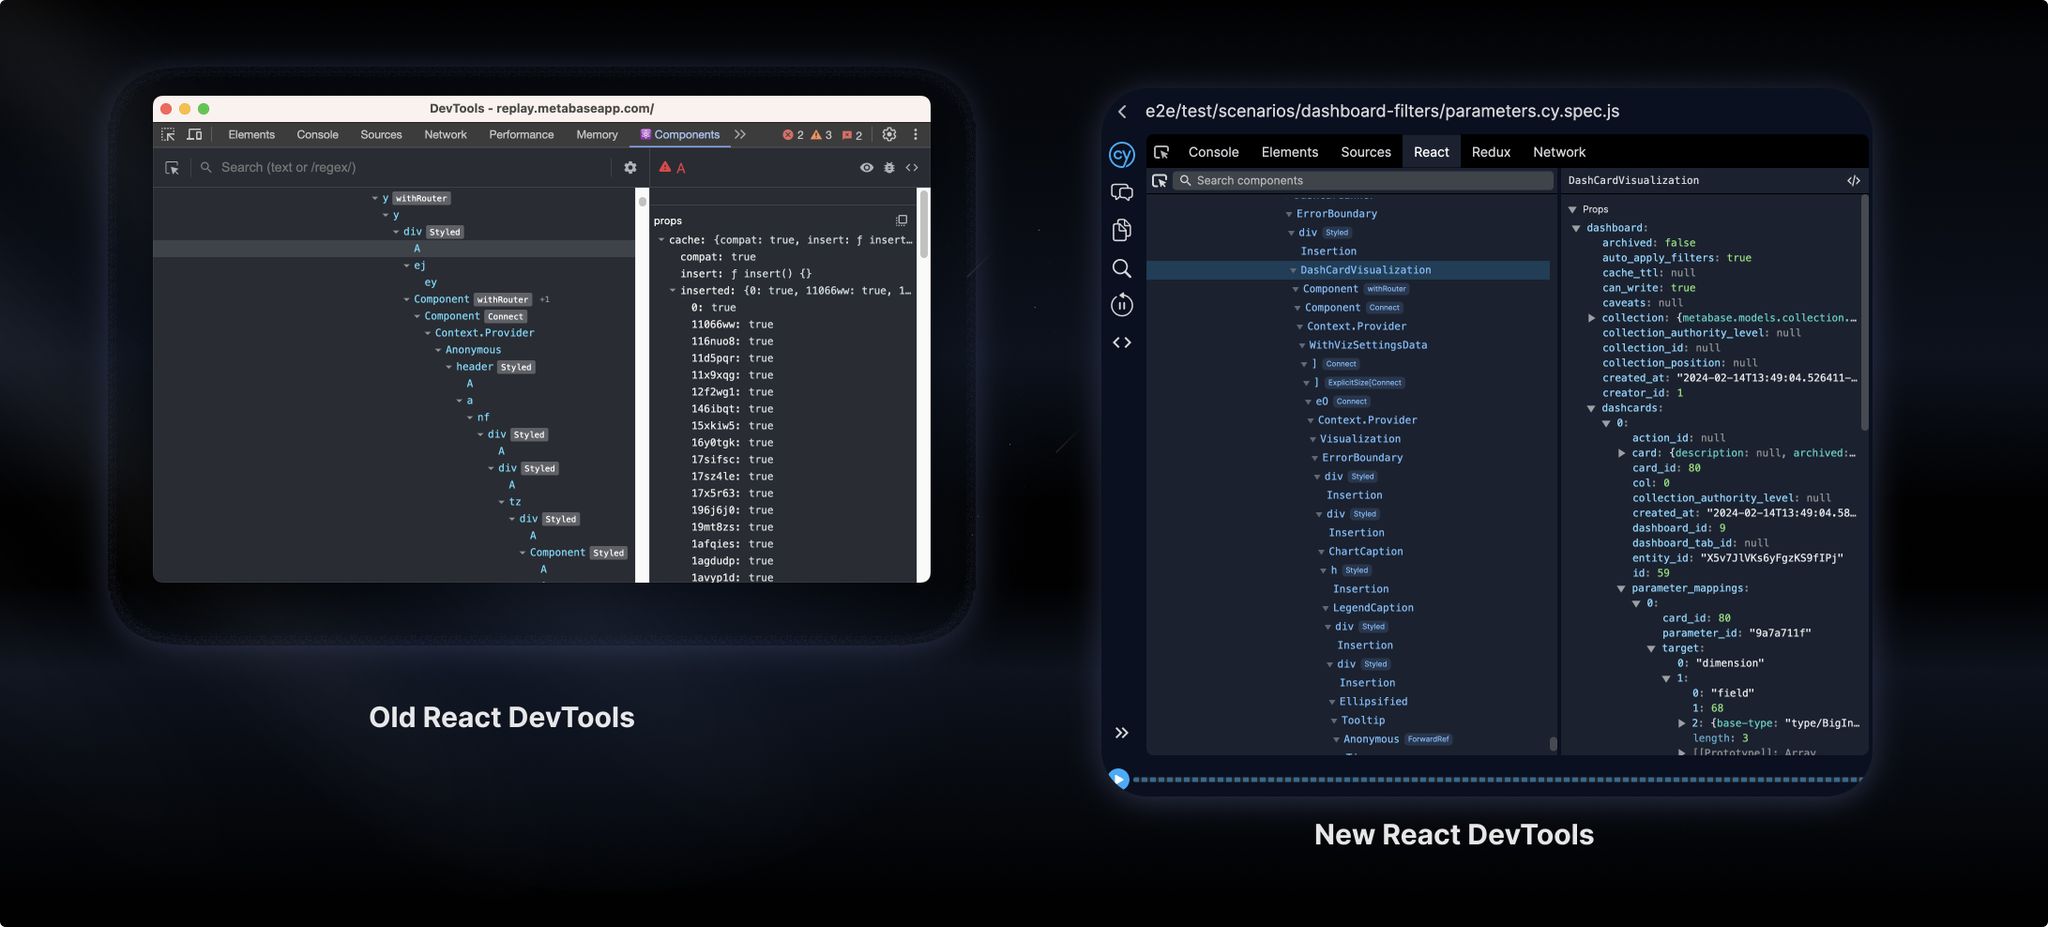
Now that we have our own UI, there’s so much we can do to visualize component renders, commits, and hook events. We always say this, but we’re literally scratching the surface. React is a declarative framework that’s all about reacting to data changes, and that makes it the perfect subject for some incredible time travel interactions.
The time traveller’s log

In August we shared a post on how Replay helped Metabase find a flake inside the “Saved Questions”
DataSelectorDatabaseSchemaPicker picker. We’ve got more stories to share. Test flakes are annoying but it’s fun to investigate what caused them. In the latest case study we go over the debugging process of a test flake that caused a loading spinner to randomly disappear. We’ve dug through React components, network panel and searched through source files to find out that what made the test unstable, was a difference of just couple milliseconds.
Additional Updates
Redux DevTools jumps to dispatches significantly faster (link)
When Redux DevTools shipped in 2017, it was magical to travel back to the point in time when an action was dispatched. With Replay, you can now travel to the execution point the action was dispatched.
Source search now lets you add include and exclude file paths (pr)
It’s now easier to see where variables like
incrementAmount are used and because Replay knows which lines of code were executed, we can dim the lines that were not hit!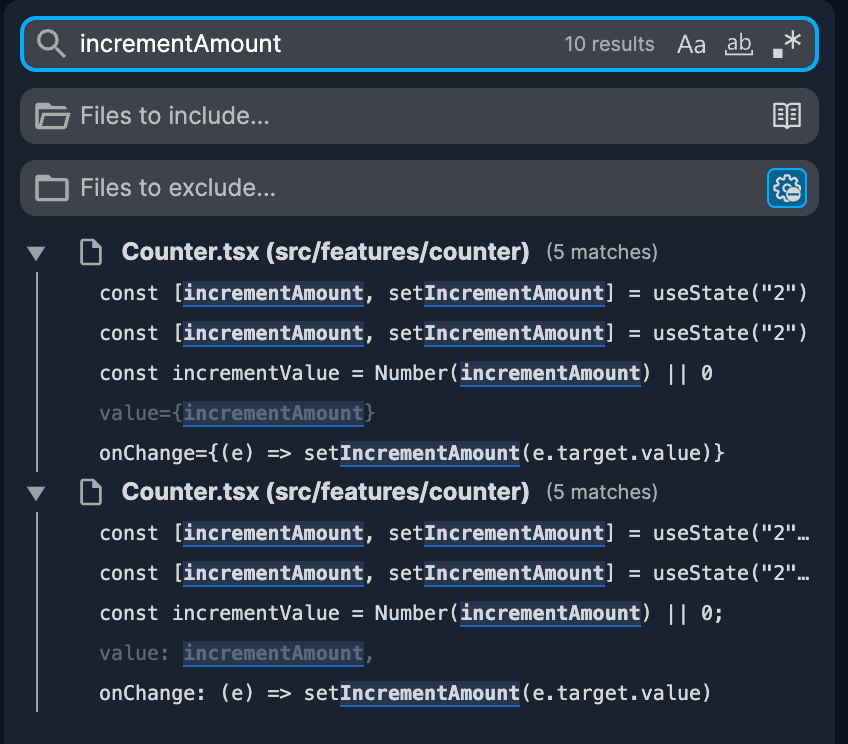
The Element Panel’s Node Picker and React Component Picker are now synchronous (PR)
Nothing beats going from an async api call to a synchronous instant update especially when it’s a core operation like finding the UI element and component you’re looking for.
Happy time traveling,
The Replay team
