One of the most common questions we get is: “How is Time-Travel Debugging different from Session Replay”? In this post, we’ll outline where each excels and why we chose the name Replay.io despite the obvious confusion. 😄
Tl;dr
Session Replay tools record a video with additional metadata. Time-Travel Debuggers record the runtime so you can debug it later with breakpoints.
What is Session Replay?
Session Replay tools are JS libraries that instrument the application as it is running. They often record a video and events like mouse clicks, console logs, and network activity. There are two popular use cases: recording sessions in production and recording one-off sessions.
Recording Sessions in Production
The two most popular production session replay tools are FullStory and LogRocket. DataDog and Highlight.run are now entering the space as well.
These tools are best for getting product insights. Internally, we use LogRocket to see how developers are using Replay’s DevTools. Because session replays include the user actions, it is easy to find all the sessions where a given action occurred.
Session Replay tools are also useful for seeing what the user did before an application crash. It’s pretty common for us to see an error in production and watch the session in LogRocket. While these videos are useful for seeing what the user did, you still need to reproduce the issue locally in order to find the root cause.
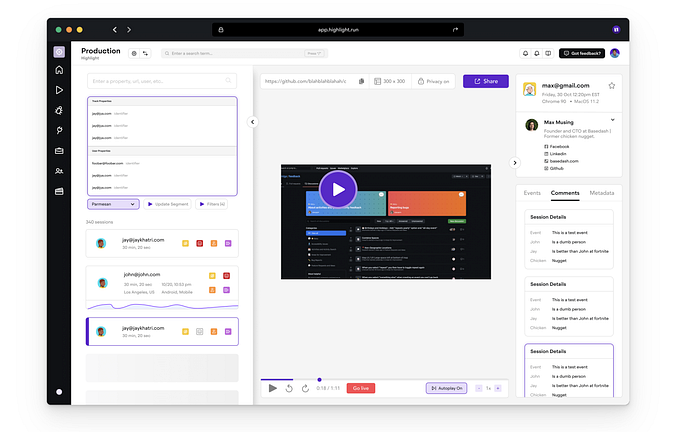
Highlight.run
Recording One-Off Sessions
The two most popular one-off session replay tools are Bird Eats Bug and Tango.us. Bird Eats Bug makes it easy to record bug reports and product feedback. Tango.us makes it easy to record product tutorials for internal teams.
Because these tools provide a light weight chrome extension for recording, they are often described as “Loom for bug reports” or “Loom for tutorials”.
One-off session replays are useful when you want more context than a video can provide. Bird Eats Bug reports include console logs and a notepad for summarizing the bug report. Tango.us breaks the session into useful steps so you can document each part of the process.
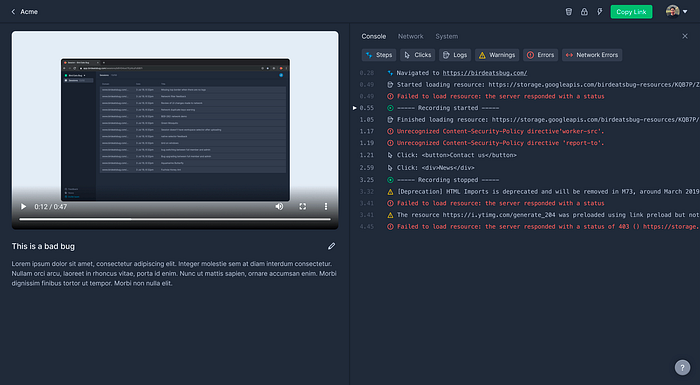
Bird Eats Bug
💡 Because Replay.io is a Time-Travel Debugger that also has video and comment functionality, you can use it for one-off recording sessions as well.
What is Time-Travel Debugging?
Time-Travel Debugging is the ability to replay the runtime exactly as it ran before. If a team member records a replay on a Windows laptop in Japan and shares it with you, you will see exactly what they saw.
The browser thinks it is running in Japan on that same Windows laptop, but in reality it is just reading from the recording.
👉 The ability to replay the runtime is where Replay.io got its name!
Time-Travel Debugging is not a new idea, it is just incredibly difficult to pull off in practice. Computers execute billions of operations a second. If the wrong operation runs out of order, the recording will diverge and fail. For a more in-depth explanation, feel free to read this series on How Replay Works.
Recording Bug Reports
Today, the most common workflow is bug reporting. When someone on the team sees a bug, they can record it with the Replay browser and add the replay to the ticket in Linear. This means anyone can debug it without first having to reproduce it.
Because Replay has a fork of Firefox, Chrome, and Node, Replay can also be used to record automated tests in CI. In the future, Replay can also be used to record the backend in production.
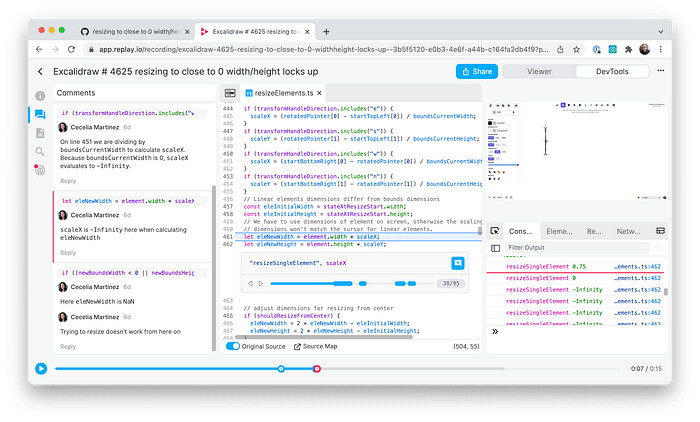
Replay.io
Being able to replay unlocks four opportunities:
- Reproducibility: With Replay, you only need to record the bug once! Once the bug is recorded, you can add the replay to Jira and developers can debug it directly without having to reproduce it.
- Print Statements: When developers add a print statement in a replay, Replay re-runs through the recording, re-evaluates the print statement, and shows the logs in the console.
- Developer Tools: Replay has fully-featured Browser Developer Tools (Elements Panel, Network Monitor, Console) and you can inspect any Element or JS Object at any point in time.
- Collaboration: Because recordings are replayed in the cloud, it is possible for multiple people to view the same debugging session.
Conclusion
While they may seem similar, Session Replay and Time-Travel Debugging have different use cases. Ultimately which tool you use will depend on what problem you are trying to solve. If you need reproducibility, collaboration around a single source of truth, and powerful developer tools with print statements, a Time-Travel Debugger like Replay.io is your best bet.

