I joined Replay in January as a Community Lead and was excited to hit the ground running.
Merging that first pull request is a rite of passage with any new company, and this was a fun one because I gained real world experience using Replay to debug Replay!
To be honest, I was a little nervous. I have software development experience but hadn’t pushed production code in over a year. But, dogfooding your own product is important, and if Replay is going to help developers of all experience levels demystify debugging, the best place to start was with myself!
These are the steps I used to debug the issue, which can serve as a good framework for approaching many types of bugs.
Reproduce the issue
Jason our CEO first identified and reported the bug in this GitHub issue. Like with all our issues, he included a replay of the bug. The replay is public, so feel free to follow along!
If you haven’t used Replay before, it lets you record a browser session to produce a shareable replay for collaborative debugging. The replay isn’t just a video — everything from the browser is recorded so you can inspect ✨ ALL THE THINGS✨ .
The ‘Why Replay?’ guide in our docs is a good overview if you’re not familiar.
💡 A reproducible example of a bug is required for debugging. Trying to debug without one is almost always impossible because you don’t have insight into what’s happening with your code.
Right away I could see the issue in the Viewer.
When using the Command Palette and selecting Open Viewer, the side panel doesn’t switch the way it should, and the layout gets — to use the technical term — borked.
This is a less common method for switching views. Typically you’d use the Viewer/DevTools toggle in the upper right-hand corner, which doesn’t result in this issue.
Understand the expected behavior
With a reproducible example, I can move on with debugging. At this point I don’t even have a developer environment set up for this codebase, and I don’t need one! I can do all my debugging right inside the replay.
💡 When debugging an issue, you need to understand what working looks like before you can fix what’s broken.
Replay includes the code from the browser. We’ve also added source maps to see how the browser code maps back to our actual source code.
I knew this bug didn’t occur when using the toggle to switch views. So that means there must be a difference between the working code and the code causing the bug. Again, I’m brand new to this codebase, so I need to understand what the working code looks like.

ViewToggle.tsx
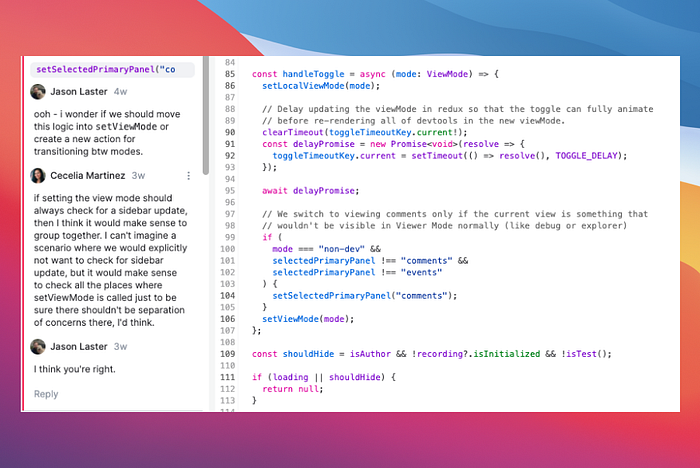
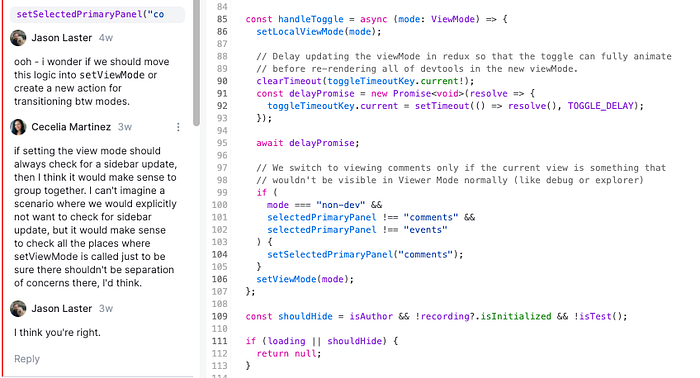
With Replay, I’m able to see all of our components like I would in a code editor or IDE. Comments can be added directly to lines of code, and Jason helpfully highlighted where we are handling the toggle switch. By clicking on his comment, I was able to jump right into the
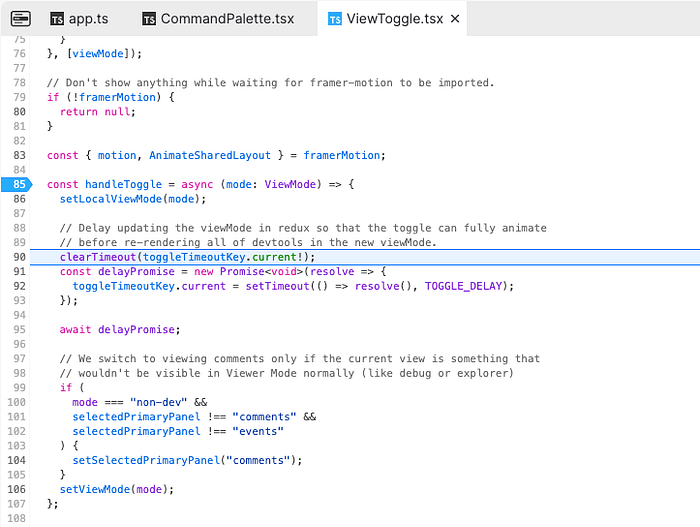
ViewToggle.tsx component file I needed to understand the logical flow of the view switch.Within this file, I can see there are
setViewMode() and setPrimarySelectedPanel() functions that are executed when the toggle is selected. There is also some logic that checks the current panel in view before updating.Now I know what the working code looks like — time to investigate how using the Command Palette to switch views is different.
Isolate the issue
Within the replay, I’m also able to see what code executed and evaluate expressions from any point in the time of the recording. This was helpful because I could see that the
executeCommand() function in the CommandPalette.tsx component file triggered one time. I can also see the values of the shownCommands array and the value of activeIndex at the time the function executed. This leads me to the open_viewer command, our culprit.💡 When debugging, it’s tempting to try a lot of different things if you don’t know where to start. This can lead to frustration and use up a lot of your time. Instead, try to isolate the code that actually executed as closely to the triggering event as possible.
Identify the root cause
We are so close now! Now that we’ve isolated the code executing when the bug occurs, let’s compare it to the code we already know actually works.
💡 Identifying the root cause means finding the primary reason why the code is not working. Sometimes we try to solve for side effects instead of the root cause. Try to trace the bug all the way down to its true source.

executeCommand()
This is the
executeCommand function, which we know is taking in the open_viewer key. On line 375 from the replay we see that we’re dispatching setViewMode(), but there is no setPrimaryPanel() . Caught you! 🐛🔍Implement the solution
All the collaboration on how to implement a solution for the bug happened right in the replay. Ultimately, we decided to move the
setSelectedPrimaryPanel() logic inside setViewMode() so they always happen at the same time, regardless of the source of the change. You can check out the implementation in the pull request here.
Bonus: Find a related bug
While investigating the sidebar issue, I noticed that there is another difference between the working and non-working code. Inside
ViewToggle.tsx, there is logic that delays the dispatch of setViewMode() to allow for the animation of the toggle. This does not happen when we switch views with the Command Palette.
handleToggle()
In the Viewer, I was able to see that the view in the layout updates before the animation completes. This is a separate bug that can also be addressed by better organizing how we handle changes to the view mode and having a single source of truth for updates. Check out the GitHub issue here for how we plan to approach this fix.
This is a great example of how a standard methodology for approaching debugging can help you better understand your code overall and even identify other areas of improvement.
Learn more
You can learn more about using Replay to debug your own application by checking out our documentation. The ‘Debugging a replay’ guide walks through the main debugging functionality, and if you’re interested in our open source work, check out Contributing to Replay.

