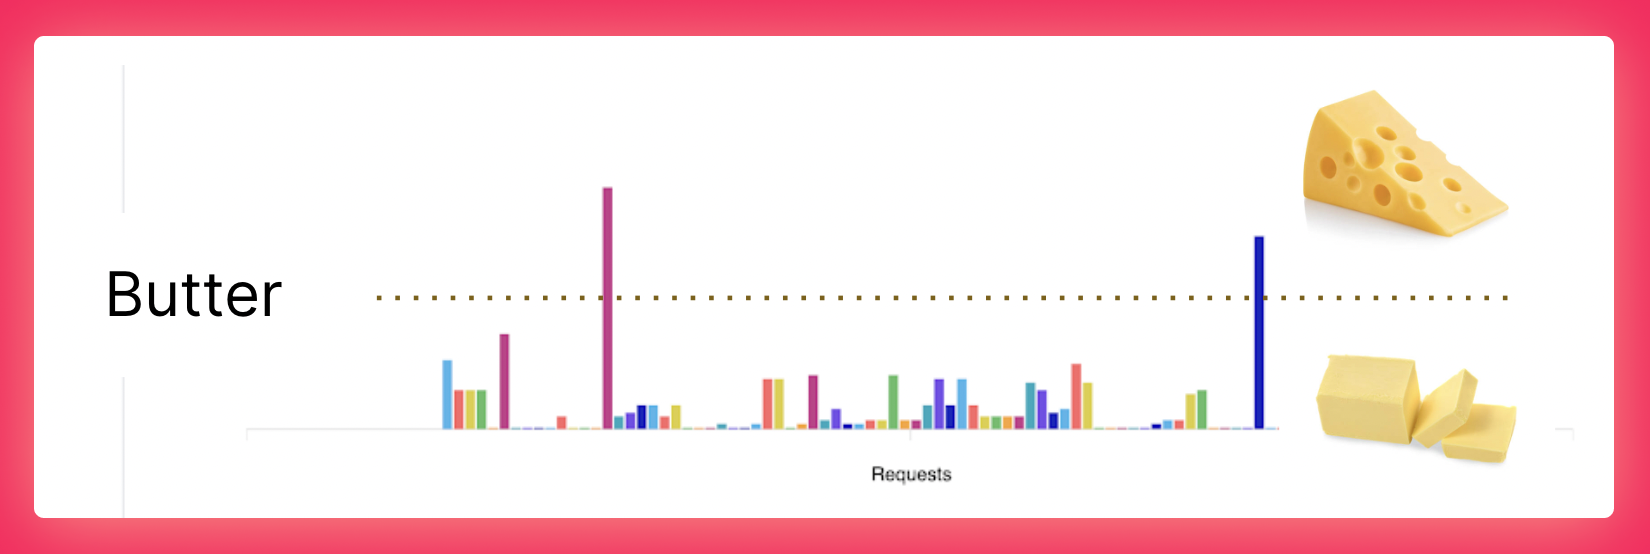
We’re excited to share that over the past six months we’ve increased our P50 Butter Score from a 30 to a 90. 43% of replays now start in 15 seconds and resolve requests in under 2 seconds.
Replays are not “buttery smooth” yet, but they are far more reliable. More importantly, we have learned how to observe and improve Replay’s backend. Here’s a Loom video from yesterday where Josh shares how he 7X’d video start times.
Our backend improvements this year have largely fallen into three buckets. First, we’ve invested in parallelization like Turbo Replay so that work can be distributed across the maximum number of cores. Second, we’ve incorporated low-level libraries like Snappy and Avro. We even taught our fork of Node how to Pretty Print files! Third, we’ve started caching expensive operations like Scope Chains and the Execution Index.
A perfect P50 Butter Score still means that half of the debugging sessions had something go wrong. That’s why the focus for next year is to increase the percent of sessions where nothing goes wrong. And by the way, there’s no reason why debugging in Replay can’t be faster than Chrome DevTools!
Thank You ❤️
We’ve joked occasionally that our early adopters have stepped over more broken glass than anyone in recent memory. Your feedback and patience has meant the world to us. That is why we’ve dedicated the year to removing the broken glass and earning your trust.
As we look forward to next year, there’s nothing that’s not possible. We’re in the process of transitioning to Chrome and will ship Chrome for Mac + Windows soon. We’re in the process of re-imagining React DevTools. If you’re not following Mark Erikson’s DevTools thread on Twitter, you should. We’re beginning to explore assisted debugging. Natural language prompts and time-travel debugging are perfect complements. And we’re getting better at recording and replaying browser tests in CI. We’re beginning to see Replay help teams fix failed tests faster and share knowledge more broadly.
It’s an incredibly exciting time to be a part of the time-travel debugging community. Time travel is as old as Computer Science, but has always felt more like a science experiment than a tool that you can use every day. As we look forward to next year, it’s exciting to see time-travel about to take off. When that happens, you should all know that as early adopters, you were part of the select few that walked over the broken glass and helped bring time-travel main stream ❤️
Additional Updates
Blog it feels appropriate that at Changelog 45 and post 72, we’re finally transitioning off of Medium and onto blog.replay.io. Big thanks to notaku.so for providing a great tool for making it easy.
Source Maps we made two improvements to how we handle stepping and hit counts for transforms like
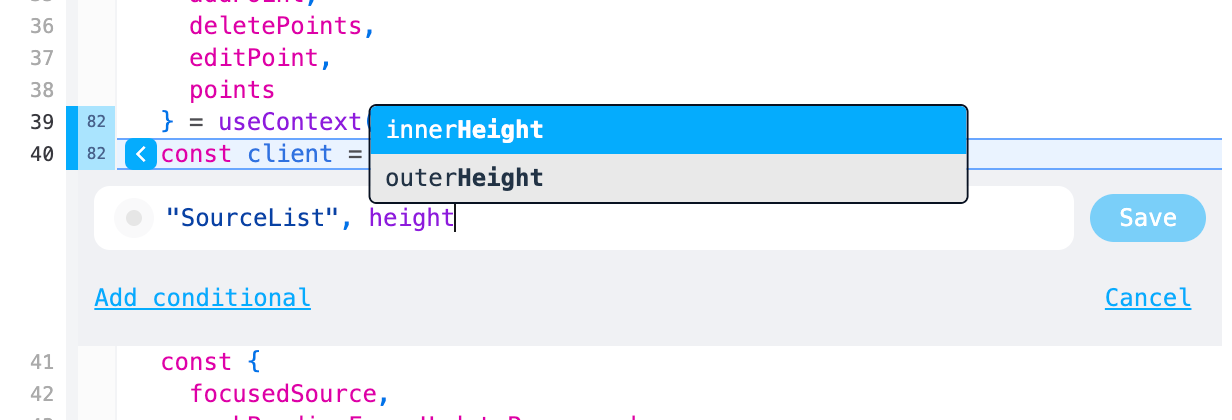
for...of. Autocomplete Suggestions now use the closest pause to populate the autocomplete suggestions.

Stepping now respects the selected frame so that you can more intuitively step in all directions.
Case Study
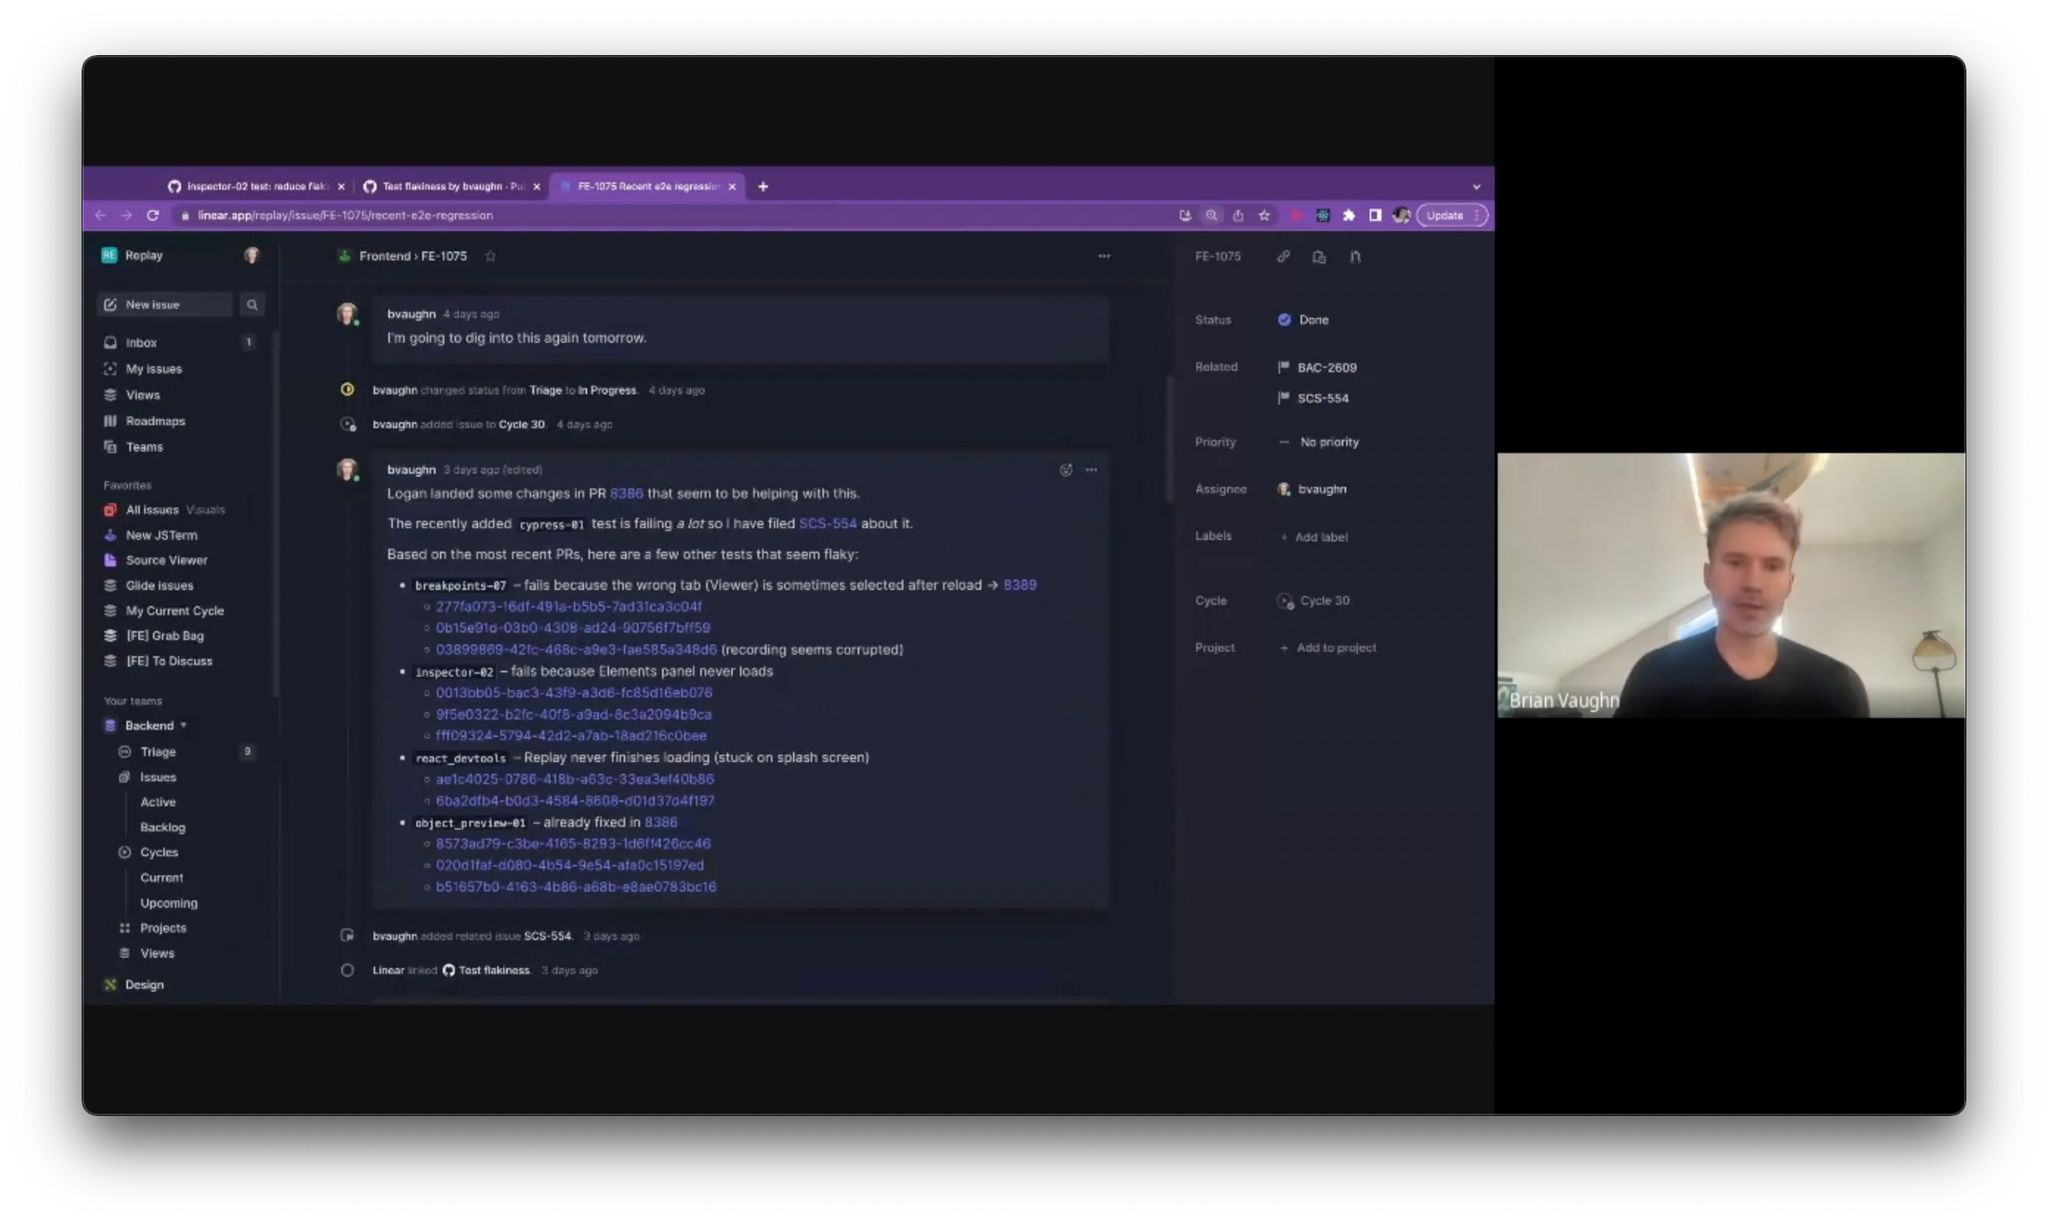
We thought it would be fun to share how Replay helped us fix four flaky tests this week. Here’s a quick video where Jason and Brian discuss the fixes.

