

Open source tools for building apps autonomously
Our library of open source SaaS apps
Using Replay Builder, we’re creating and maintaining a library of free, open source SaaS apps. These cover a wide variety of business and personal needs, and the set of apps and their features is growing continuously.
Today we're launching Replay Builder: unlimited app building with no token limits, flat pricing, and production-ready apps you can start with. Build as much as you want, for as long as you want, for one price.
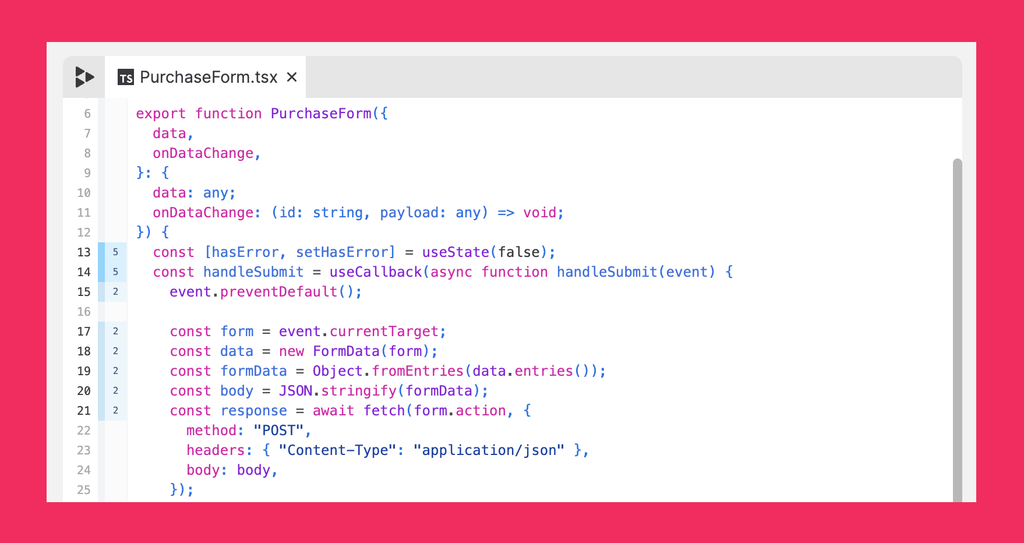
Vibe-coding apps in 60 minutes
Launching Nut as a paid service
Tech
Building random apps
Changelog
Nut’s new capabilities
Upcoming improvements to Nut
Changelog
Tech
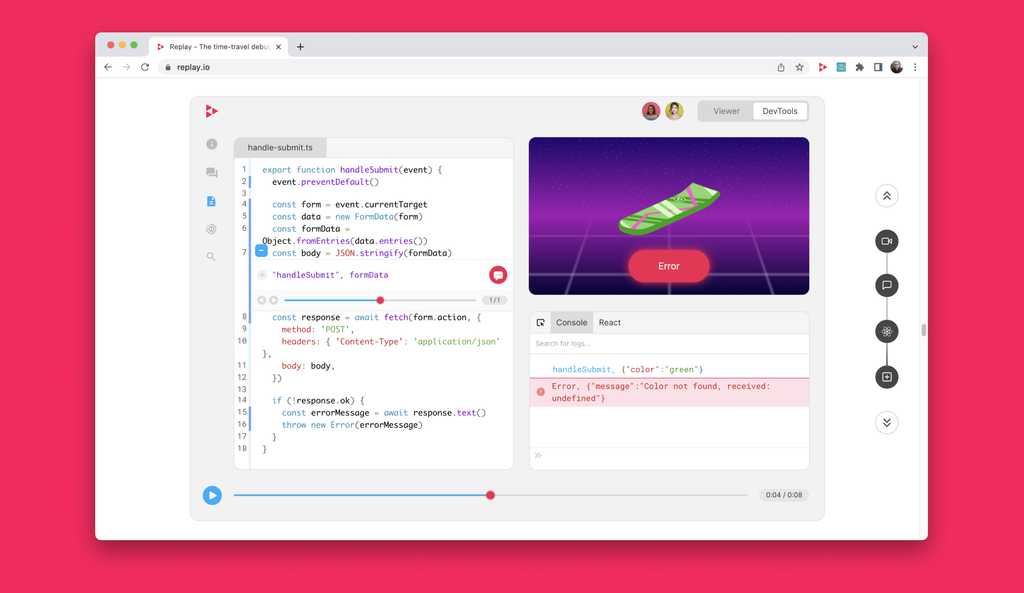
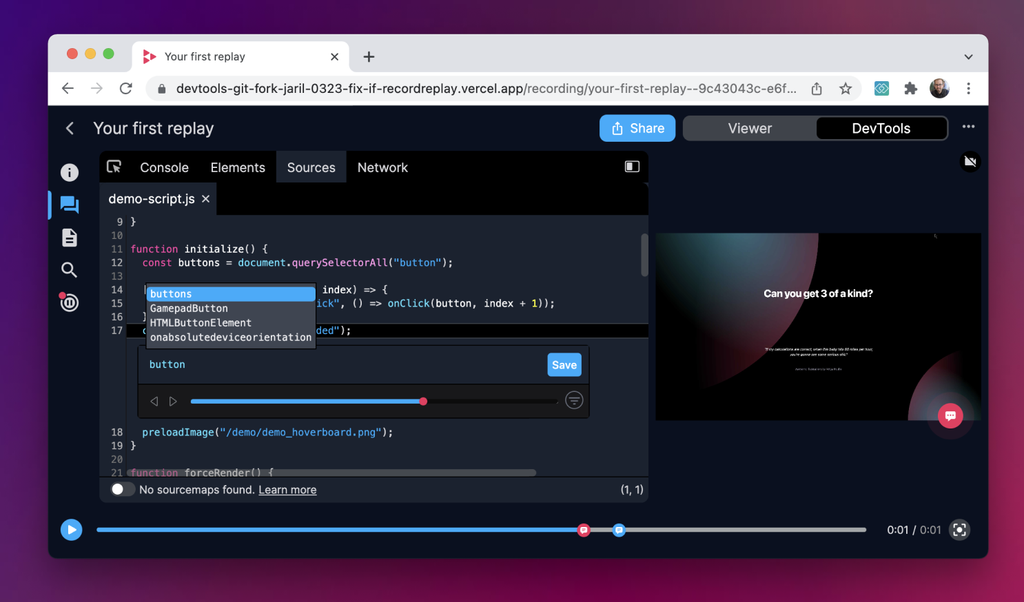
Helping you fix bugs without coding
Tech
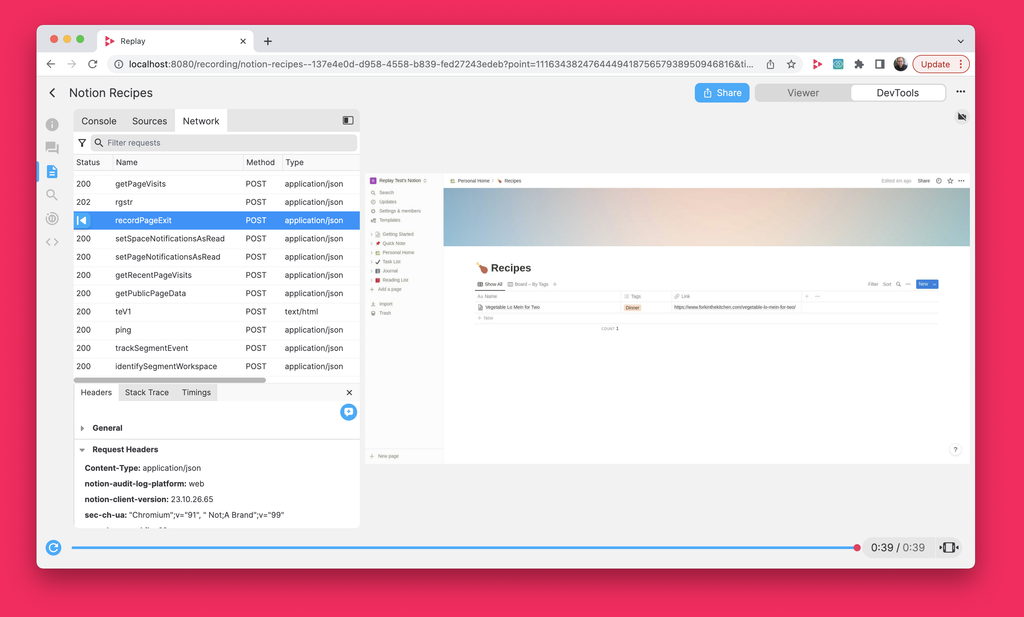
Our new API for chatting with recordings
Changelog
Soft launching our Bolt integration
On accessible software development
Case studies
We use Replay+OpenHands to automatically fix a client to handle a new data format
Story
This post is the story of how we’re giving AI devs the tools they need to be successful and the incredible results we’re beginning to see as a result. The story starts with fixing failing browser tests, but progresses towards a general purpose AI dev.
We show our prototype integration with OpenHands for reliable AI development
Tech
We describe a new technique to simplify testing patches
We share our plans on helping AIs resolve issues fully automatically
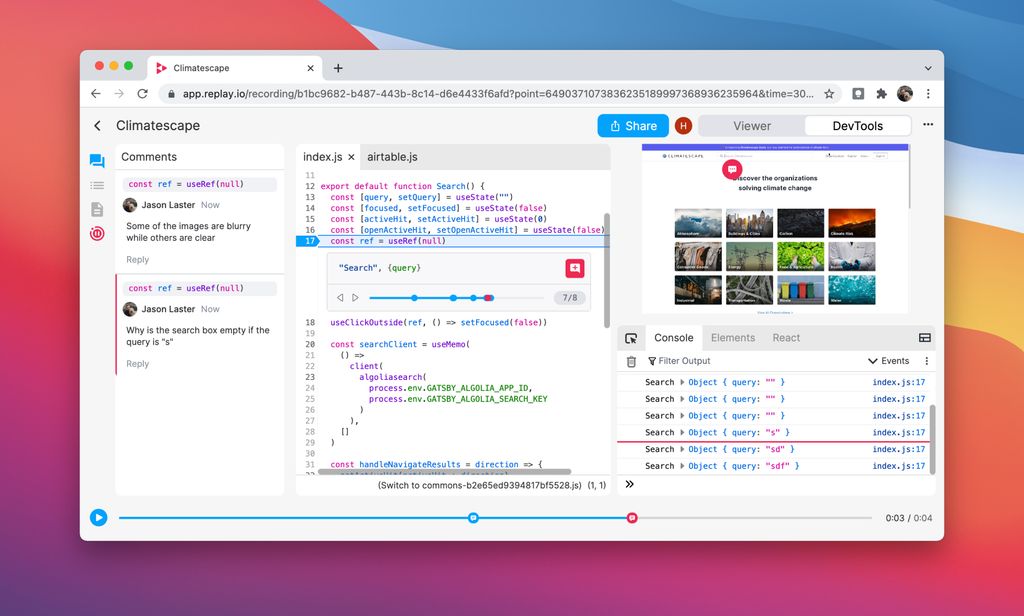
We use Replay to help AI developers reliably make a frontend improvement
Changelog
Over the past couple of years, JS frameworks like Next.js and Remix have gone full stack. We believe it’s time for DevTools to join the party!
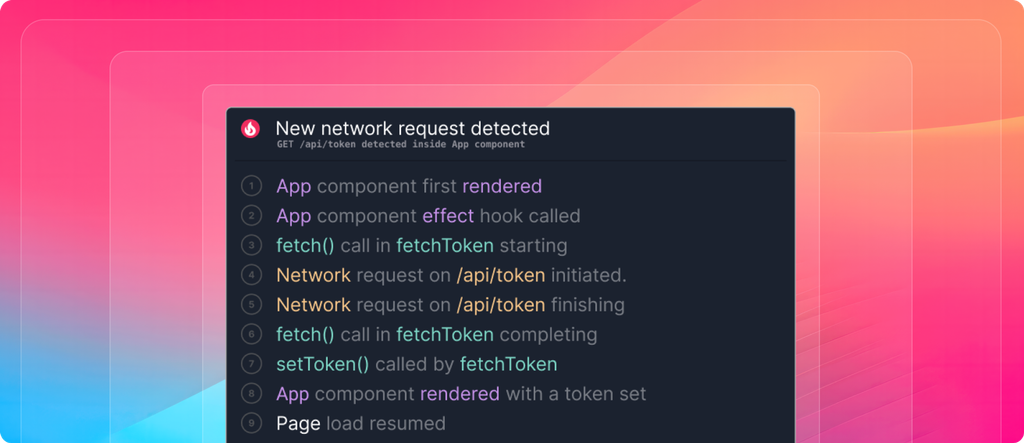
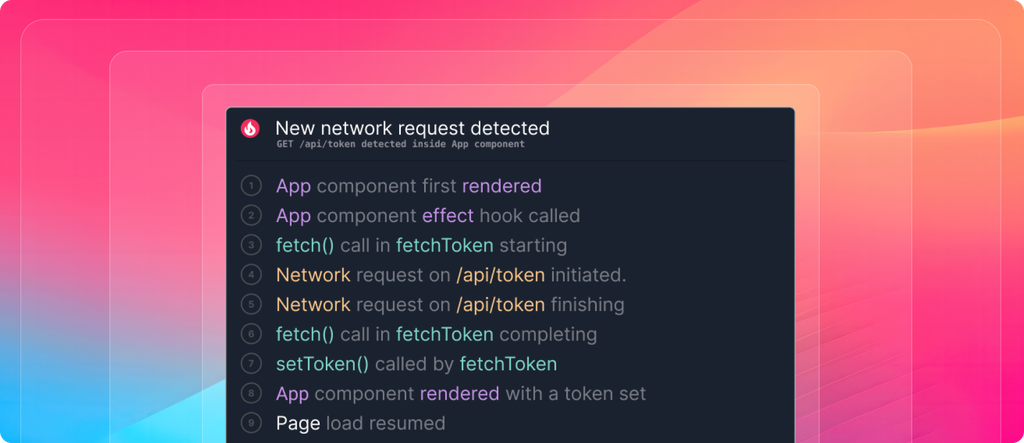
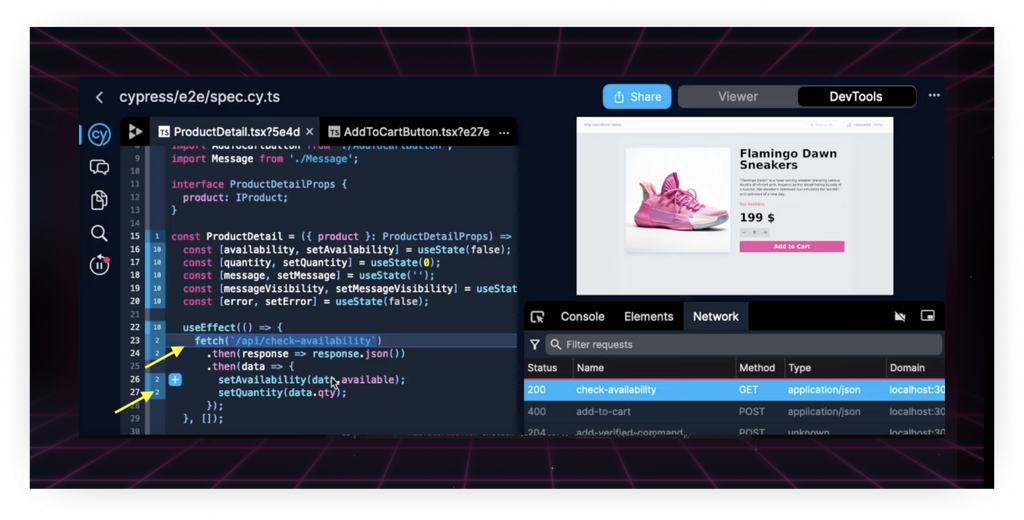
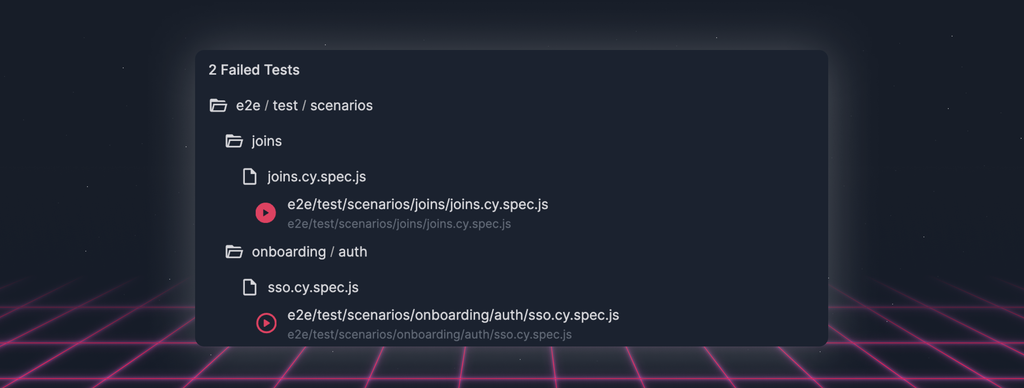
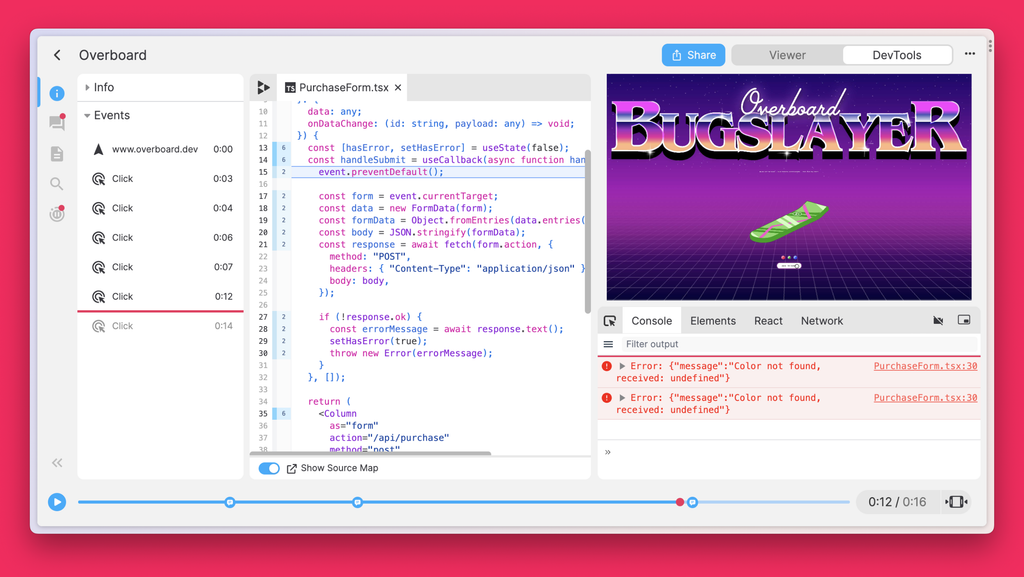
We show how to use Replay to automatically identify bad network requests causing tests to fail
We discuss a project for automatically fixing test failures
We walk through a demo and experiments with using an LLM and Replay to fix a browser test failure
Company
Changelog
We share an update on our new direction.
We share a demo of a prototype we’ve developed for debugging an application’s full stack.

Company
We are discontinuing Replay Test Suites so that we can focus on exploring the intersection of replayability and AI.

Company
Changelog
We are discontinuing Replay Test Suites so that we can focus on exploring the intersection of replayability and AI.
We’re thrilled to share our progress on Performance Analysis: the first practical way to catch performance regressions before they ship to prod.
In this post we develop the ideas underlying Replay’s upcoming Performance Analysis, using a real world regression drawn from the development of our devtools.

Changelog
We’re thrilled to share that we’ve officially migrated from Firefox to Chrome. It’s been a long time coming, but Chrome is better in every way.
Case studies
Test Suites
In this failure, we look into a bug where a React component calls
Math.round and gets a different value when the test passes and fails!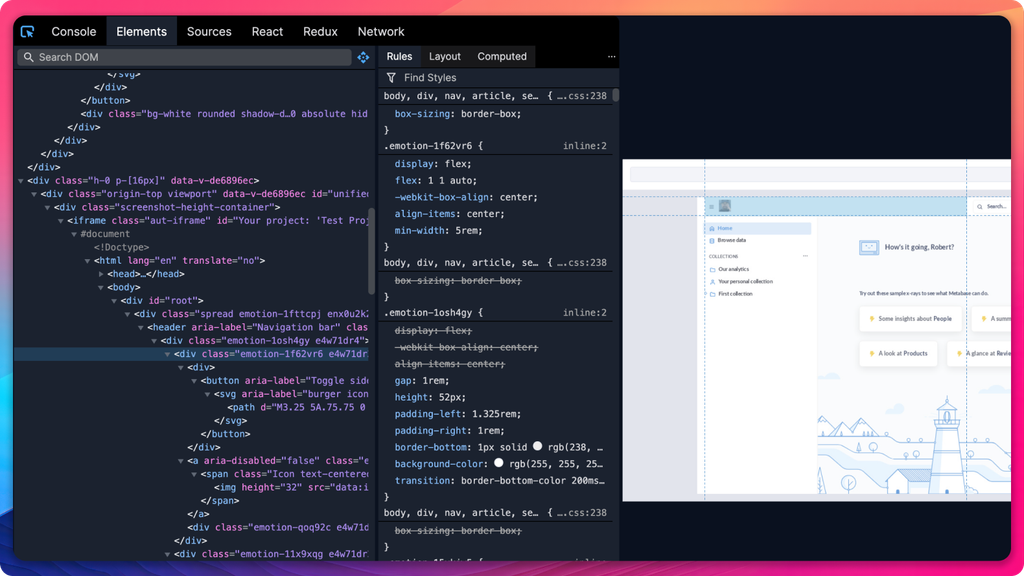
Changelog
This week we’re excited to share Elements Panel V3, which brings one second element loads.

Changelog
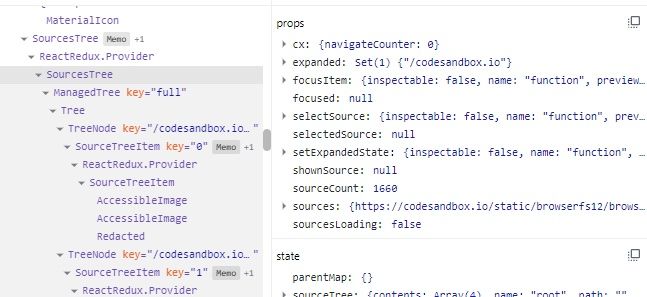
Today we’re excited to share an entirely new version of React DevTools which Brian Vaughn wrote from scratch.

Case studies
Test Suites
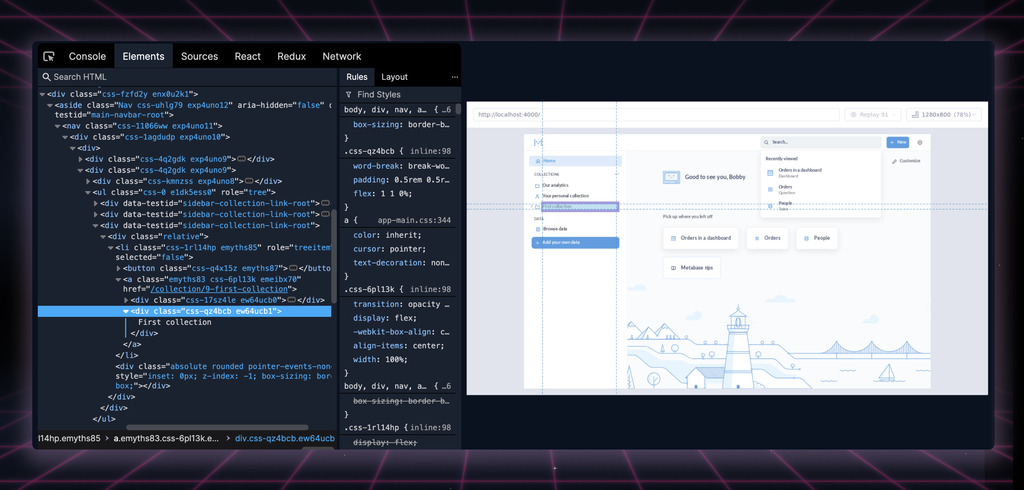
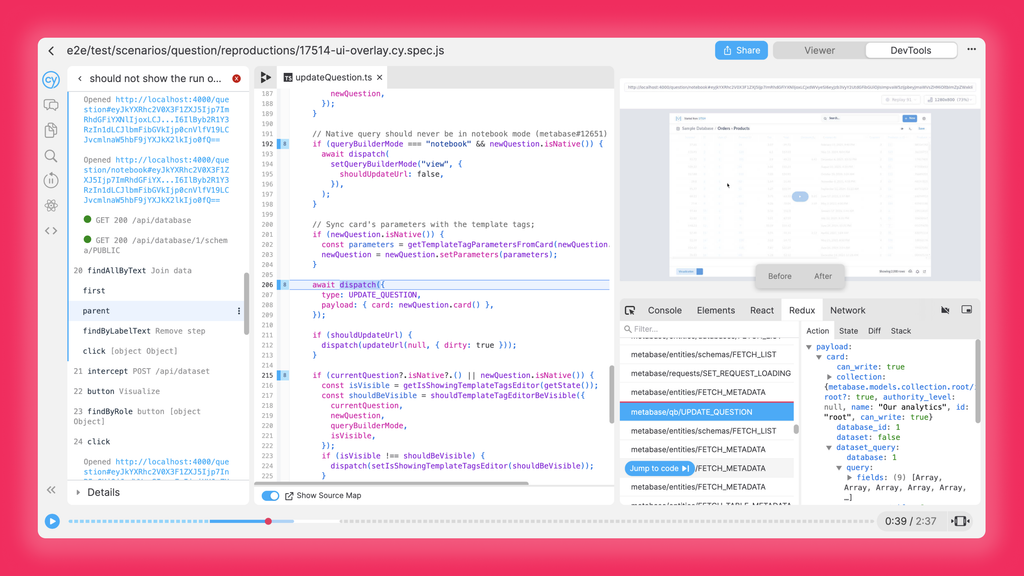
Even seemingly minor changes to your code can have unexpected consequences for your e2e tests. We have been repeatedly learning this lesson while helping Metabase drive down their e2e test flakes.

Case studies
Test Suites
Over the past 6 months, we have been helping the team at Metabase. Together with the team, we went over hundreds of test runs and conducted root analyses of e2e test flakes. We decided to share some deep dives into the discovery journey.

Changelog
Today we’re excited to share the new time travel aware Full Text Search. The next time you search, you’ll notice that we’ve dimmed out the results which were not executed.
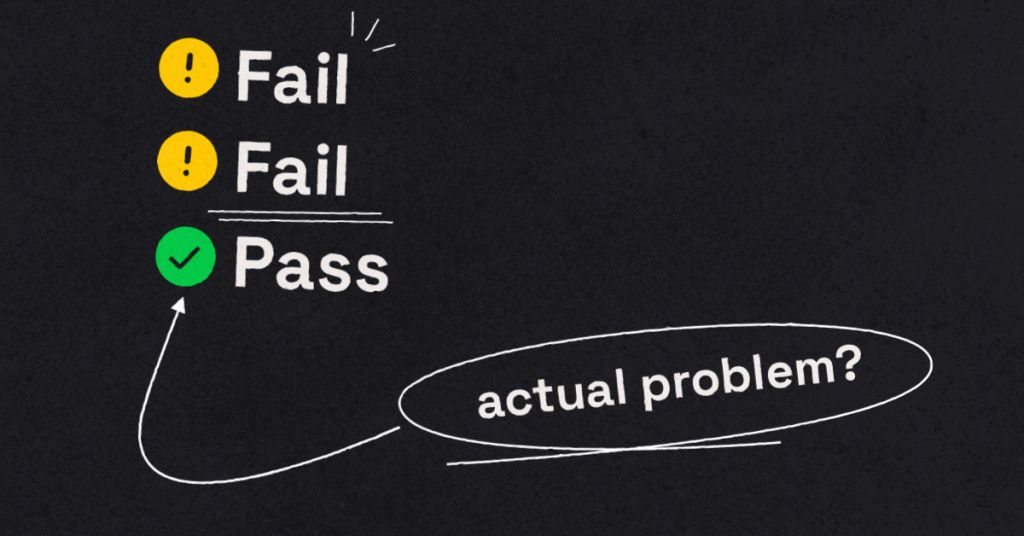
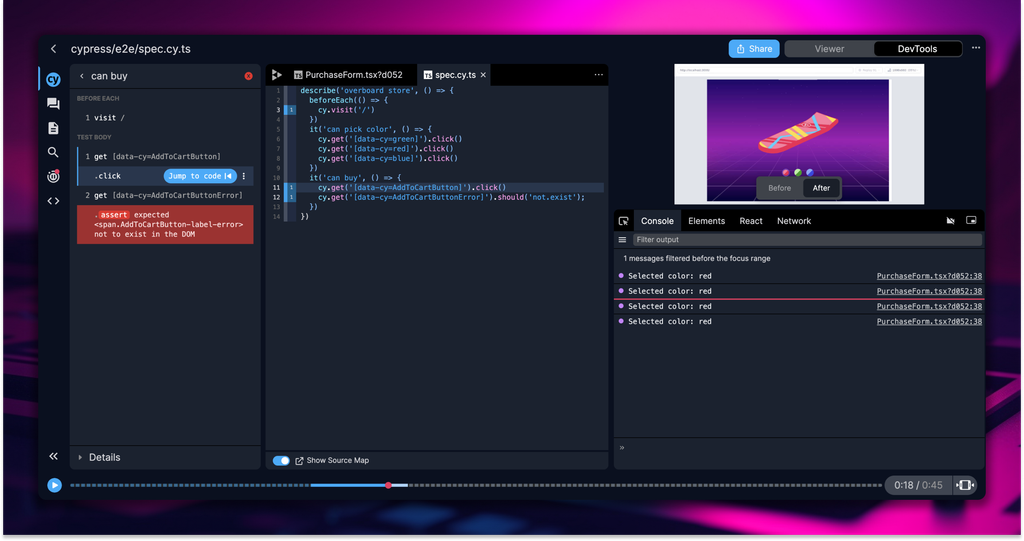
Test flakiness is annoying, but it can sometimes point to a real problem in the application. This is sometimes referred to as “false positive”. A false positive happens when a test should fail, but instead it passes. Learn how you can find false positives using Replay.io.
Changelog
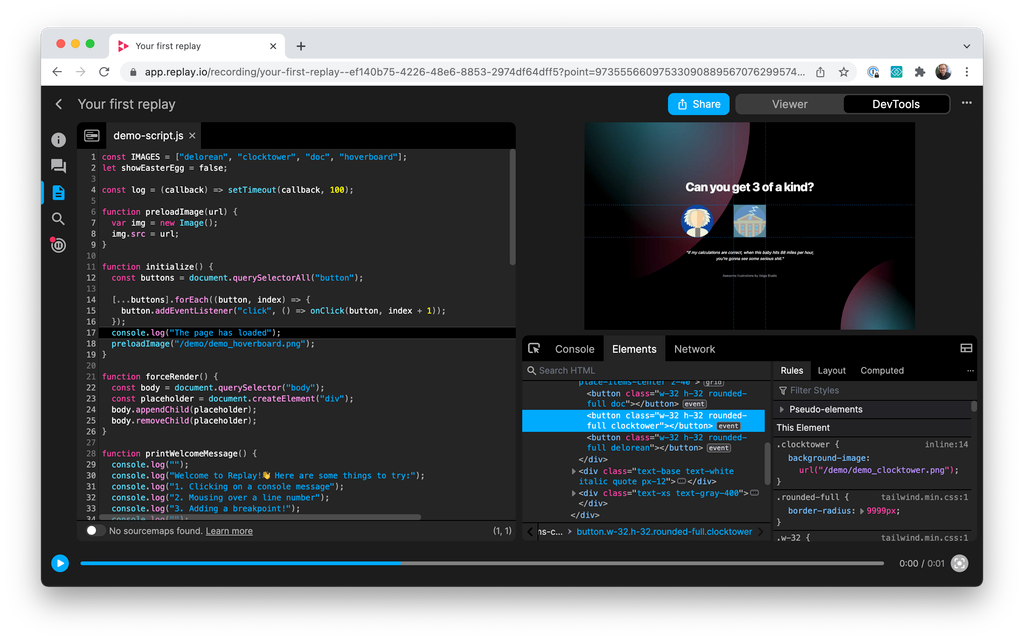
Today we’re excited to share our new Elements Panel. The next time you open a replay and inspect an element you’ll feel the difference.
Changelog
Today, we’re excited to share our progress helping customers debug their flaky tests.
Changelog
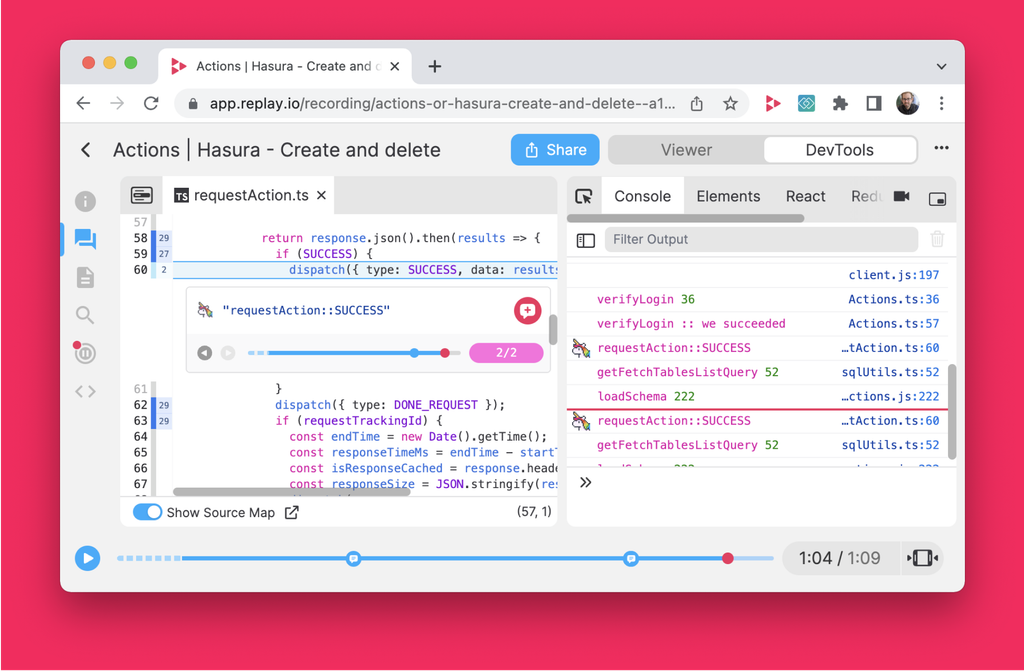
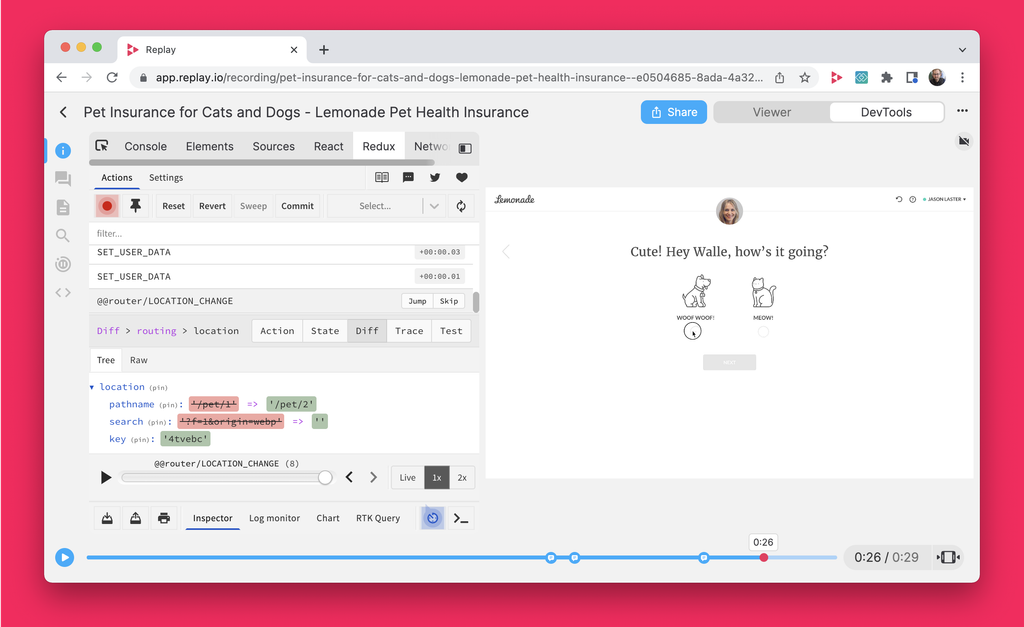
We’re excited to share an experimental version of Redux DevTools today. If you open a Chrome replay, you’ll see the Redux tab in the bottom right.
Test Suites
Case studies
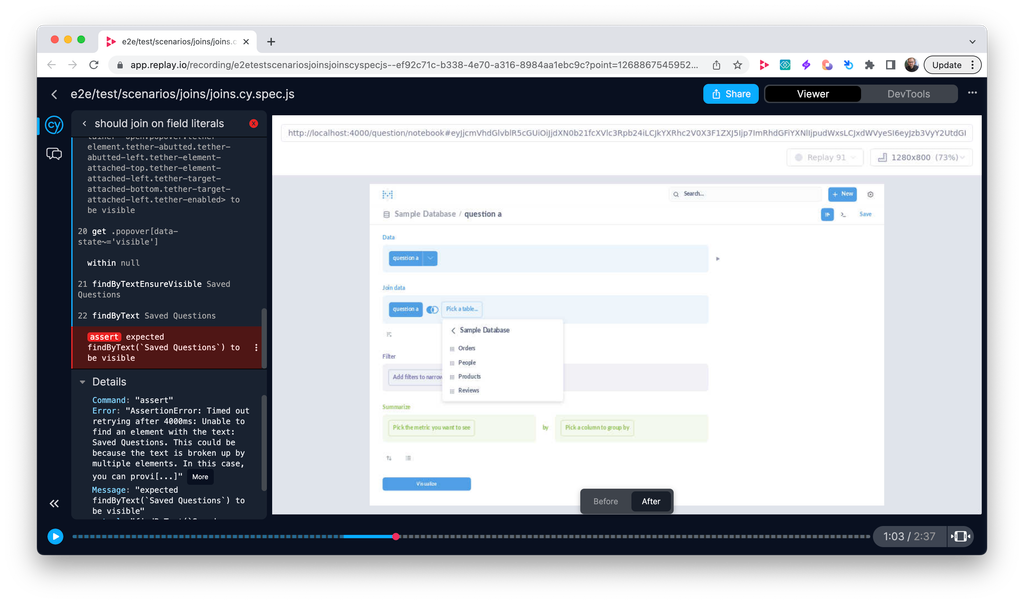
This blog post walks through how you can use Replay to debug a real world flaky test that we investigated with the Metabase team.
Changelog
Today we’re shipping a big little detail, the processing badge. The next time you open the Test Suite dashboard you’ll see which replays have been processed. And when you open a replay that’s not been processed, you’ll see that we’re first processing it.

We’re excited to share the next installment of Instant Replay. When you open a replay that’s previously been opened, the viewer will be available in approximately a second.

Changelog
We’re excited to share that Replay’s recorder is now 54% faster. Recording a replay is now faster than recording a video and comparable to recording a session replay.

Changelog
We’re thrilled to share Replay for Test Suites. It’s now easy to record your browser tests in CI and debug them after the fact.
Changelog
Today we are thrilled to release Replay for Test Suites. Test Suites join Bug Reports as an entirely new way to capture and fix hard-to-repro bugs.

We’re excited to release Original React component names for Chrome. When you open a replay that’s recorded with Chrome and view the React DevTools panel, the component names will be mapped.

Changelog
Today, we’re excited to release Instant Replay. Instant Replay is one of those updates that changes everything and is the reason we’ve been heads down the past six weeks.

What exactly is time travel? How do we ensure we can reliably record and deterministically replay any website?

This post walks through the fundamental concepts needed to make a performant time-machine.

Our plans to reach seven second start times by June. The new React Timeline and suspense architecture.
Changelog
Today we’re excited to release shared print statements. When you open a replay, you’ll now see print statements added by others.
We’re excited to be shipping the React Events Timeline today! The next time you select a Click event in the Events Panel, you’ll seek to the component’s onClick handler!
Changelog
We’re excited to share three big Chrome updates today: Chromium 108, Elements Panel, and React DevTools!
A deep dive into using time-travel debugging superpowers to analyze recordings and extract React DevTools data
Changelog
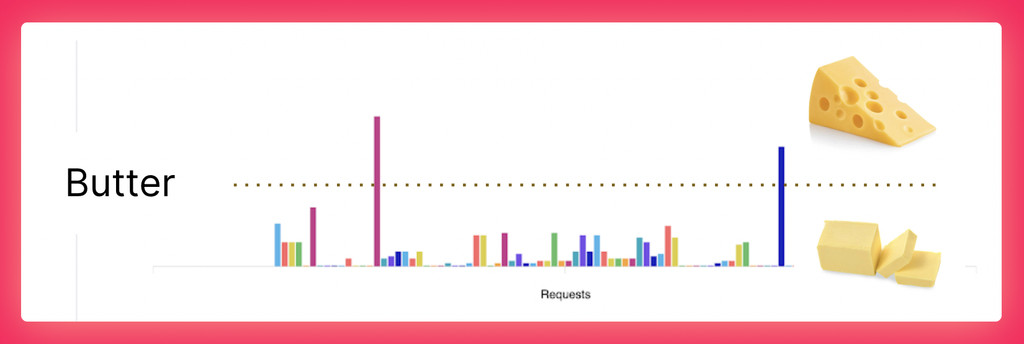
We’re excited to share that over the past six months we’ve increased our P50 Butter Score from a 30 to a 90. 43% of replays now start in 15 seconds and resolve requests in under 2 seconds.
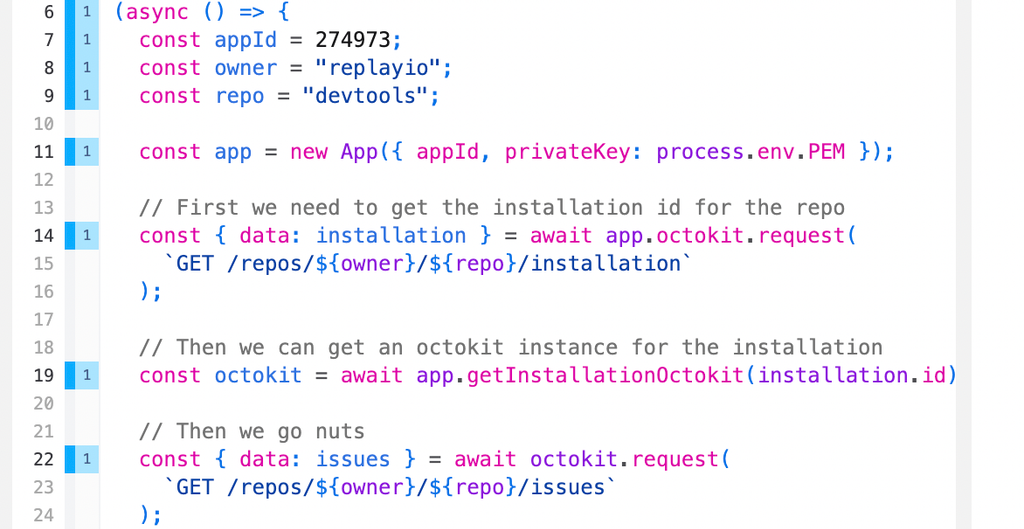
The best way to setup an octokit instance so that it can interact with the API on your behalf.
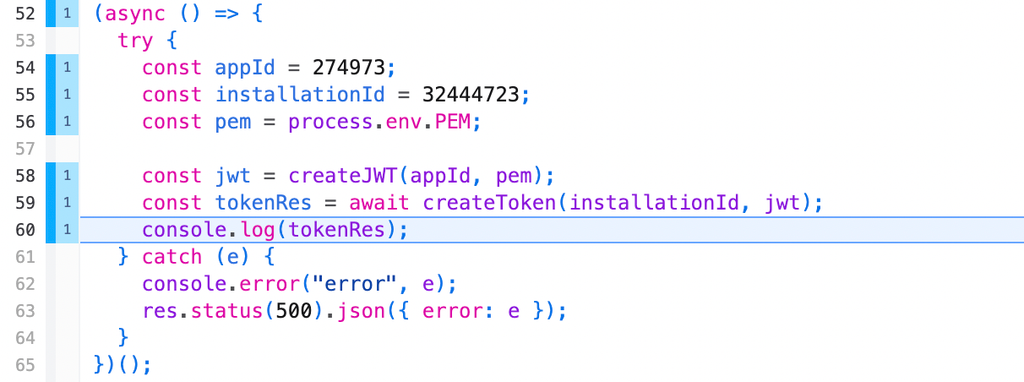
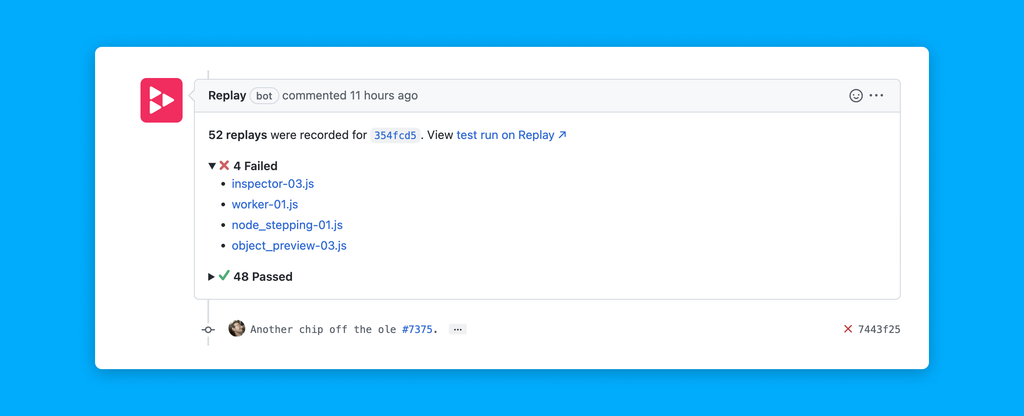
How to set up a GitHub App that can listen for pull requests and create checks.
Changelog
Test Suites
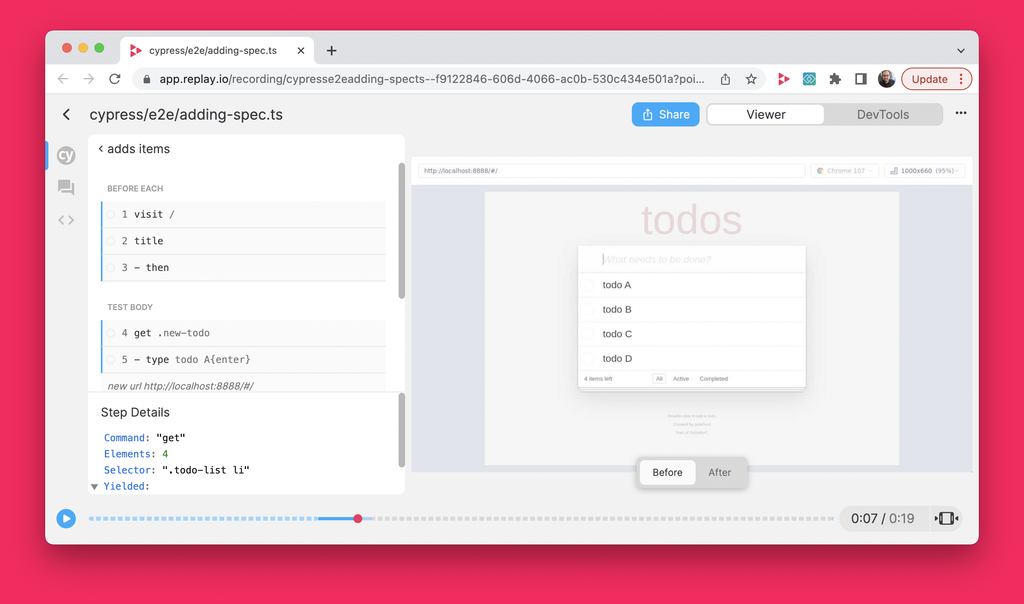
Released the Cypress panel, our third framework integration, to bring local debugging into CI - join our beta. We had some fun with ChatGPT and print debugging. We released a new comments editor, stepping machine and updated source search.
Changelog
Released execution cache compressing thousands of GBs in execution indices so that recordings are tens of MBs. We also said goodbye to Code Mirror and published a case study with Midnite.

Case Study: Midnite uses Replay to fix issues between frontend and backend, adopts in Support workflows, design and code reviews, fix network issues with live betting, and in CI to debug test failures before shipping to production.
We shipped the Network Monitor, a big step for recording e2e tests. We kicked off a “runtime as a db” project to store in-memory execution which will give us a performance boost. We also shipped a new source viewer.
Changelog
Thank for the reaction to our new landing page, reply to get some swag. We also made some performance improvements, added new UX for print statements discoverability and published a video with Basement Studio on how we built the site.
Changelog
We launched a new landing page with a nod to Bret Victor and a quote from Pantheon’s CEO, “if a picture is worth a thousand words, a replay is worth a thousand pictures.” We also talk about where we going with Test Suites and an offer for some swag.

Changelog
Test Suites
We announced two big Test Suite updates - switching our default CI browser to Chromium and an update to Cypress and opening the beta to more partners. We also featured one of our beloved users, Mateusz using Replay to debug a Typsescript error.

Changelog
We shared updates to Replay’s reliability and our strategy to remove broken glass from the UX. We went deeper on Backend performance, a new Console in Devtools, an update Frontend architecture and another Mateusz feature to fix an issue in Redux with Mark.
Case studies
Case Study: Tablecheck uses Replay to manage issues across multiple markets, frontends and tech stacks and in communication between QA and Dev teams, in code reviews, and particularly to do so asynchronously. Up next is bringing replay to CI/CD.

Changelog
Replay achieved SOC2 Type 1 & Type 2. We’re never done working on our security program and we’re committed to sharing information about our security improvements going forward.
Changelog
Test Suites
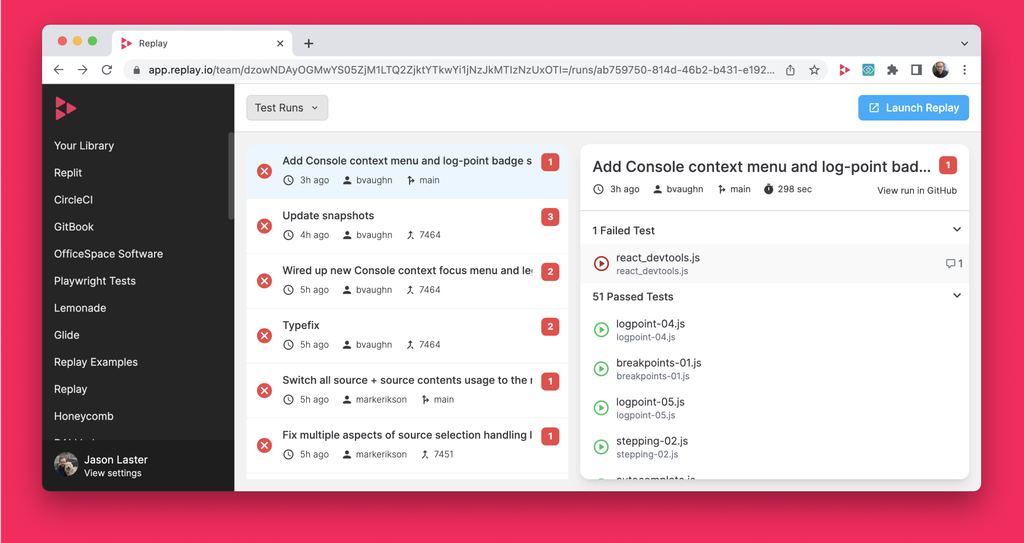
We shipped Test Suites Dashboard for Playwright - helps you see your test runs and debug them after the fact, especially useful when you see when a test started failed and compare to passing runs. We also shared updates to Test Suite Comments, Chromium, Console Search, some bug fixes around Source Maps with photos from our Summer Offsite.
Changelog
Test Suites
Test Suites Comments entered into closed beta for Playwright. We published case study with Glide. We shared updates like 4X faster scope mapping, frontend architecture changes, docs for installing certificates, source maps for Node, and other bug fixes with source maps and data fetching. Also, a fun React bug fix with Brian Vaughn.

Case Study: Glide Apps uses Replay to get out of “repro” purgatory improving developer velocity and revolutionizing QA + Support workflows and to document PRs. Glide looks forward to using replay for Node issues and in CI.
Changelog
We published our first case study with Pantheon. We shared updates to performance with faster page loads, start times and frontend architecture updates and some other bugs fixes and uses of Replay to highlight how we use Suspense Caches with Brian Vaughn.
Changelog
We shipped Heat Maps, rewrote our Object Inspector, started working on better replaying performance and made some changes to Network monitor, Focus Window and Autocomplete.

Case Study: Pantheon uses replay to debug performance issues, improve developer velocity in addressing bugs spotted from CEO and largest customers, and in ongoing dev-dev communication.
Changelog
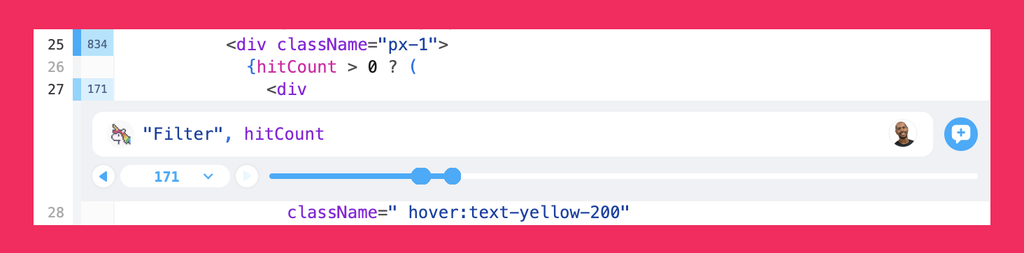
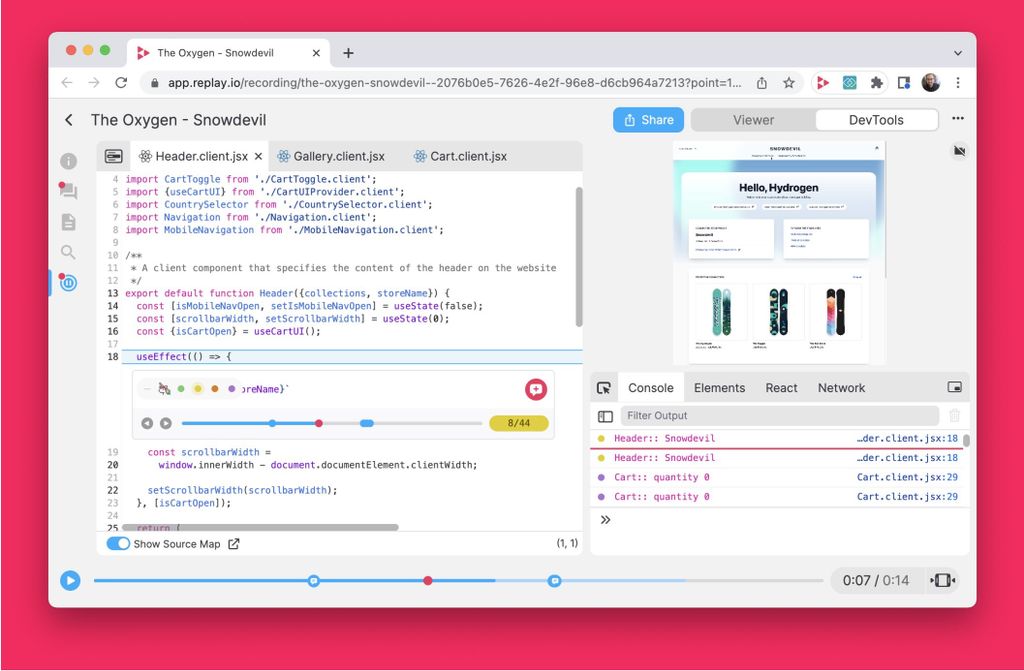
We updated Print Statement fixes so you can add a 🦄 with a single click. We also highlighted how to debug issues in Hydrogen, Shopify’s new react-based framework for building custom storefronts.
Changelog
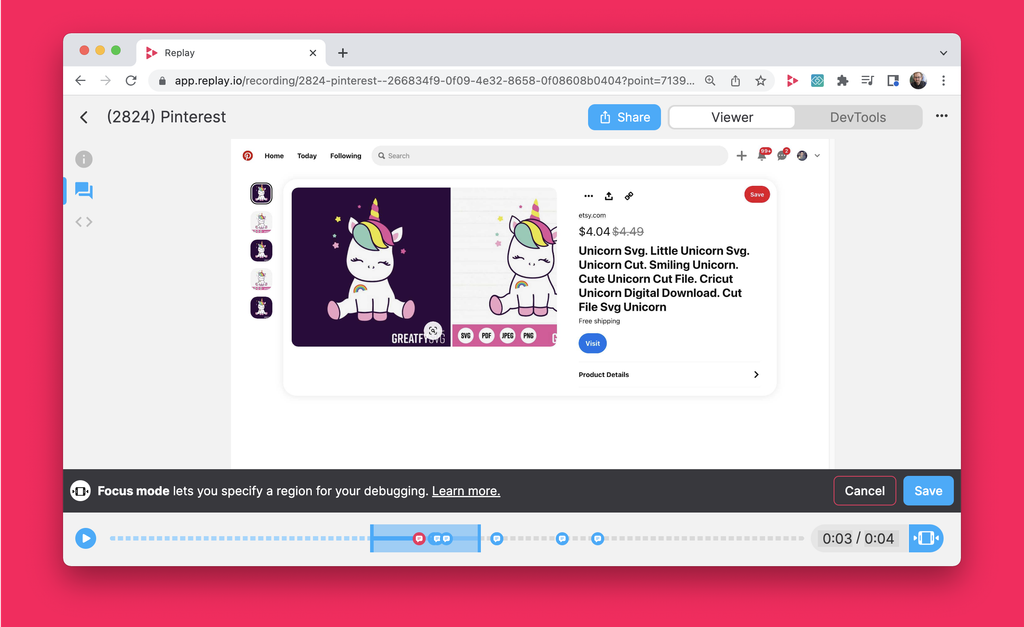
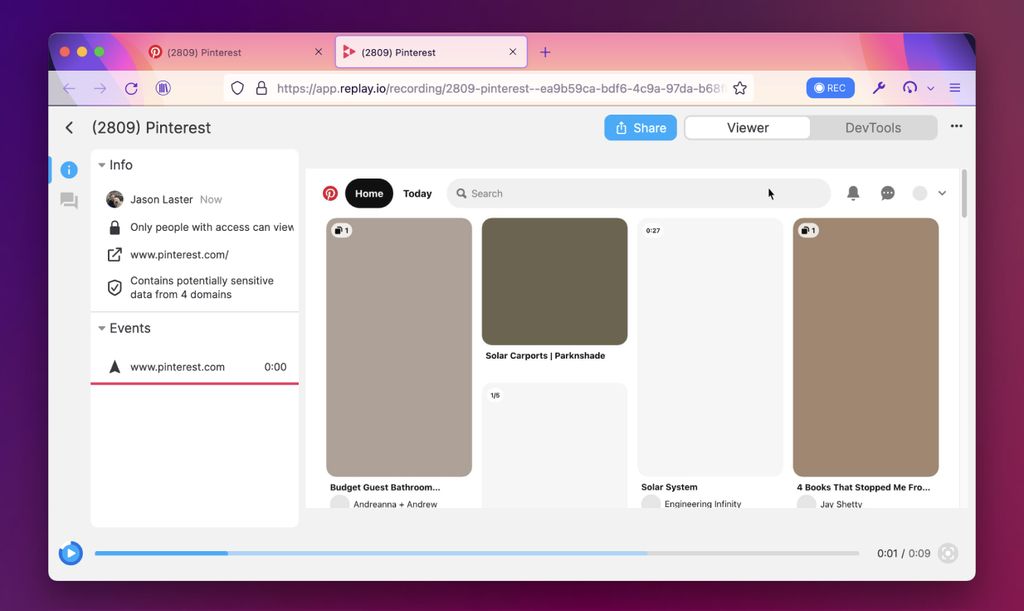
We released Focus Mode V2, which significantly more polished, faster and accurate! We alos added support for Source Maps in Node, drafted a proposal for a brand new frontend architecture, fixed some bugs and spent highlighting common pit falls of a lot of React apps at scale can hit by looking at a replay of Pinterest.com.
Iterations are where the great stuff happens

Changelog
We launched Turbo Replay allowing replays to start and print statements to be evaluated faster. We reference our Rereplayability roadmap and share updates like our rebase of our Node recorder, Protocol Viewer + Timeline and some bug fixes.

Changelog
We released Redux DevTools 0.5 (Redux DevTools was the OG time travel debugger). We made updates to our Focus Mode editor, Global Loader, Library Fileters and fixed some bugs. We also dove into Walmart.com to look at its NextJS and GraphQL stack, all inspectable in the replay!
Changelog
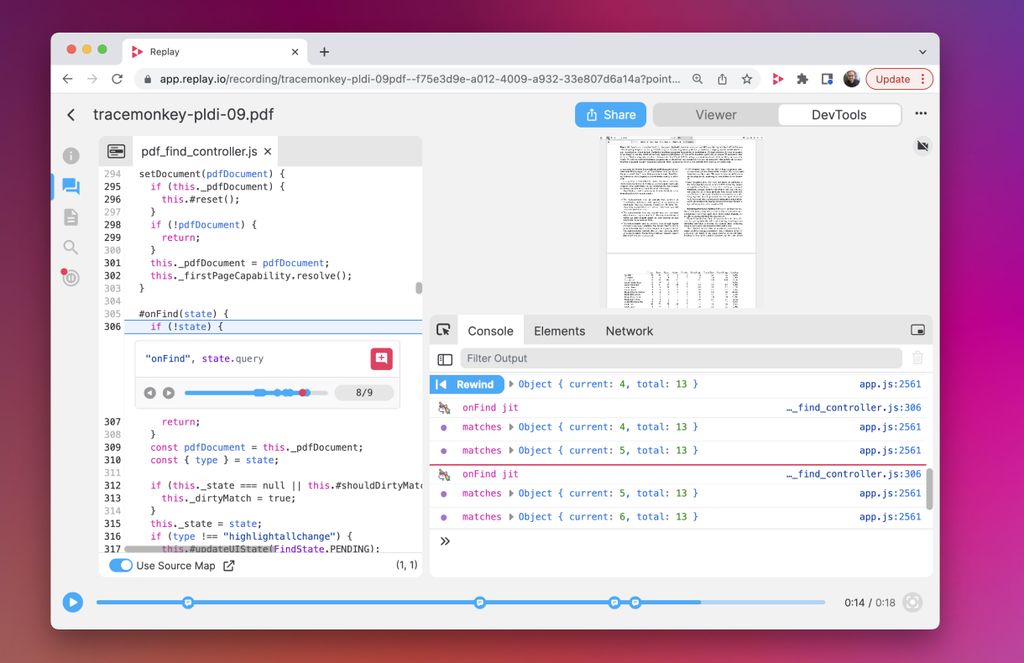
We shared the early versions of the Unicorn Console. We released the Replay Launcher, a Chrome extension which helps launch the Replay browser and highlighted PDF.js using Replay.
Changelog
We shared some enterprise security update; SOC 2 Type 1 audit completion, Self-Storage, URL Allowlist, Network Monitoring. We made some other product updates, published a blog post on how we diagnose crashes, announced our weekly Office Hours and launched replayable.dev to publish OSS bugs folks found and fixed using replay.
Changelog
We shipped Console Search and Global Search. We added some updates to the Network Monitor, Billing and our Library. We also highlighted a debugging journey with React Hooks.
Changelog
We shared some loading improvements, other product updates like command shortcuts and longer replays and linked to post “Building the Impossible” and highlighted Cleevio.com, one of our earliest users.

Culture
Blog post about how we built Replay and early lessons that cemented our cultural values.
We welcome Mark Erikson from Redux and Brian Vaughn from React to the team and share our plans for framework debugging! We also highlight other blog posts, link to our feature on Pod Rocket and highlight Open Sauced, one of our friends and early users.
Brian Vaughn joins the team!
Blog post describing Replay mechanics and how that translates to bringing time travel to React DevTools and how to bring time travel to other DevTools like Vue, Cypress, Apollo and many more.
Changelog
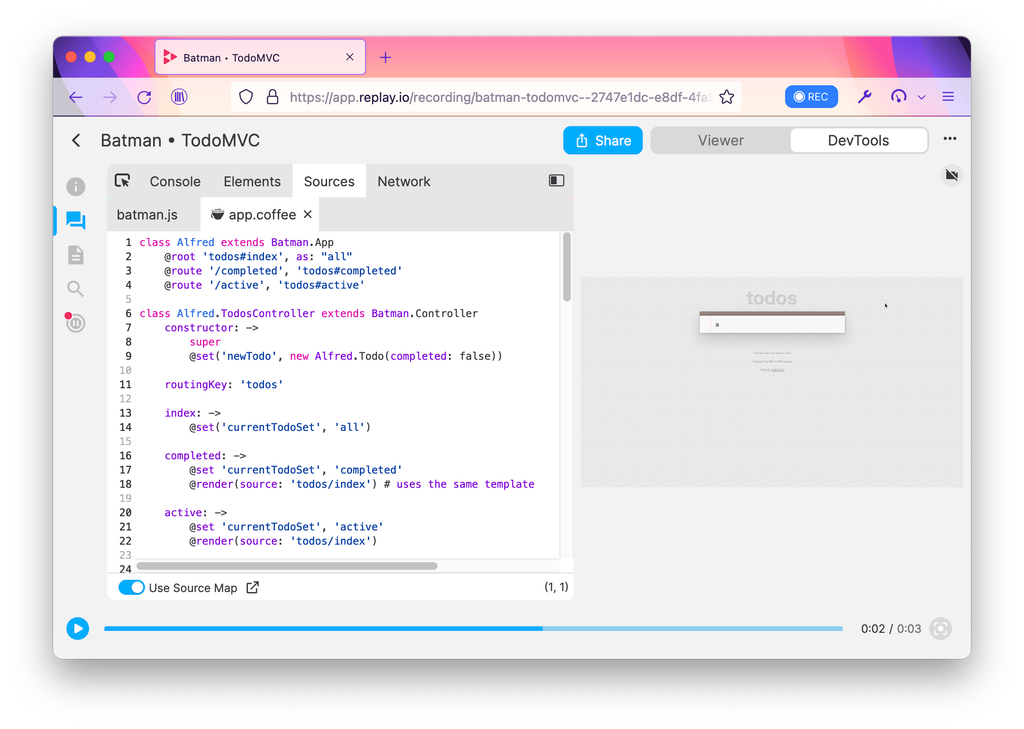
We shipped Coffescript ☕ allowing you to record CoffeeScript web apps and node scripts and then debug them in Replay DevTools.
Kannan goes deep on how to debug Replay.
Changelog
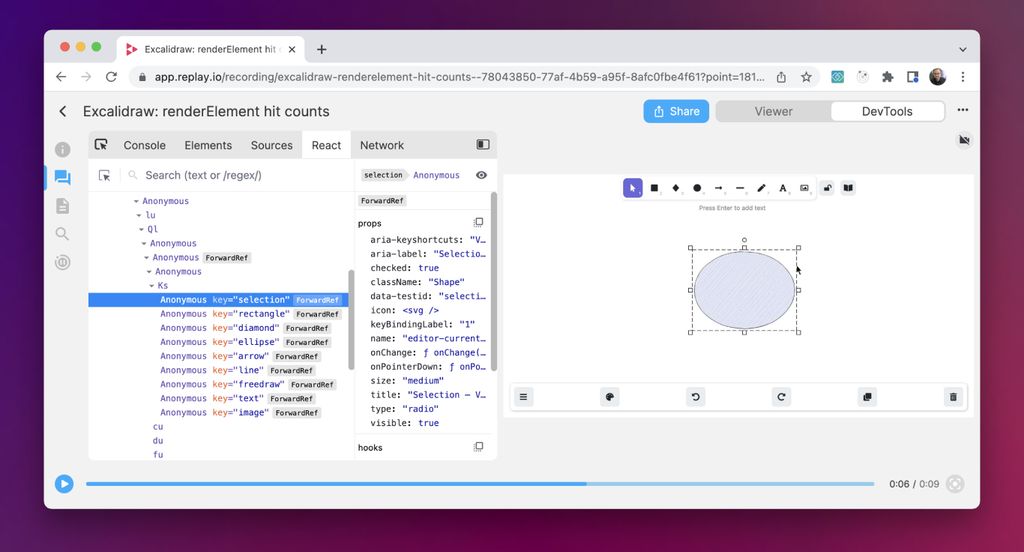
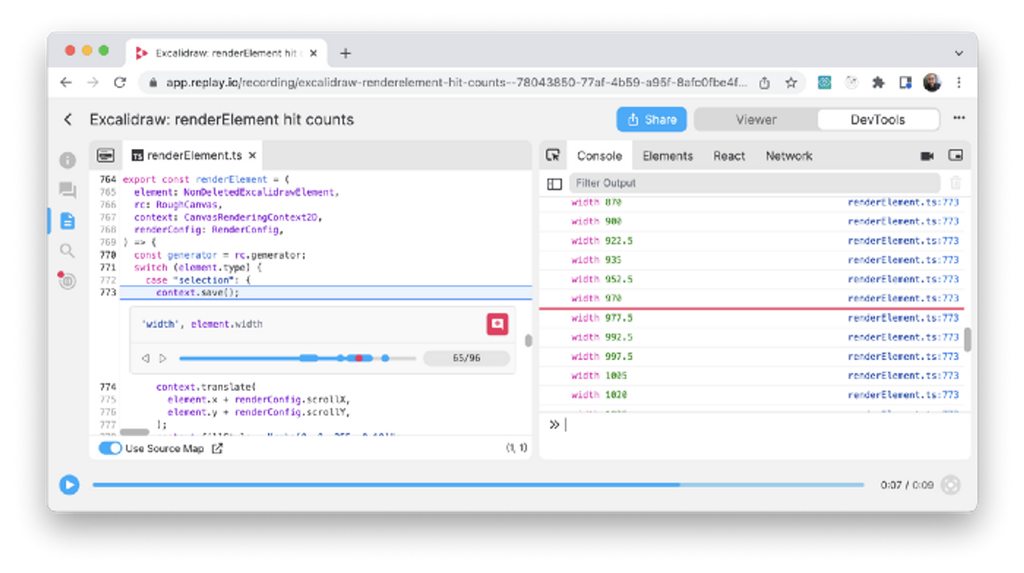
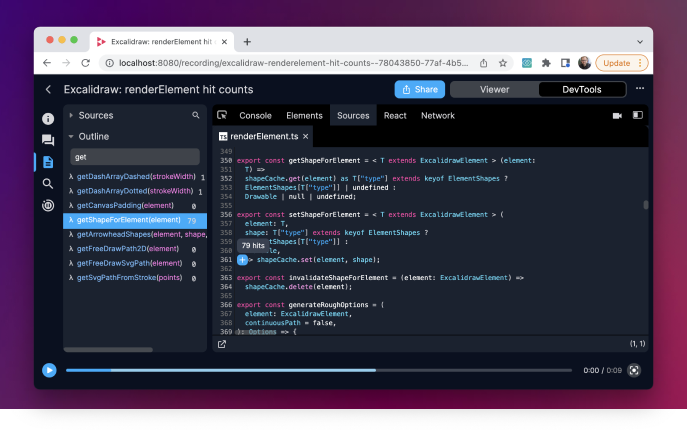
We shipped Heat Maps, when you open DevTools, select a source, and see the function call counts in the outline view; this makes debugging faster. We made some other product updates and highlighted how we used replay to fix several issues with Comments.

Story
Test Suites
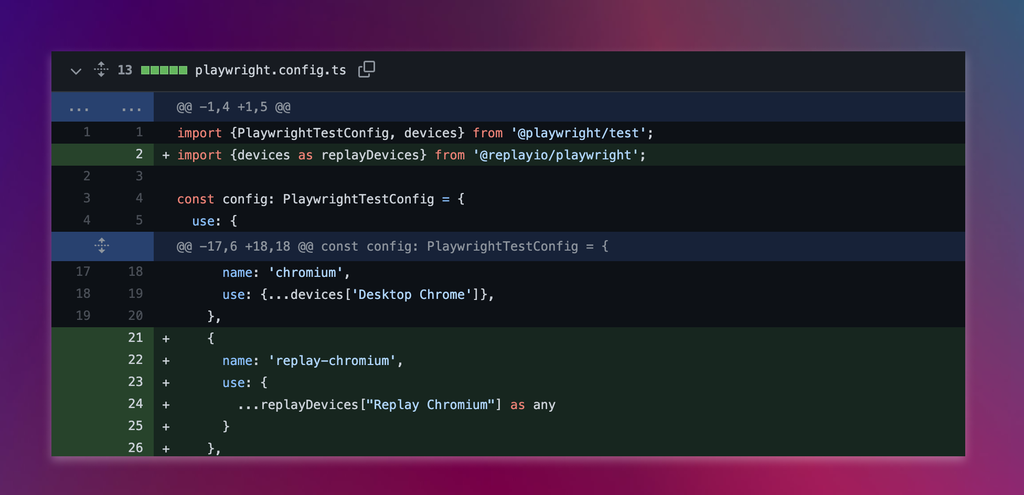
Ryan highlights some CI improvements, mainly our GitHub Actions for our Playwright integration.
Changelog
We shipped Autocomplete V2. We made some updates to Network Monitor Comments and made longer replays a lot faster. We also did a deep dive into Vercel’s Next.JS Live playground to show it’s like to edit a file and see the UI update immediately.
Changelog
Test Suites
We released Playwright support! We made some updates to command shortcuts, additional layouts if you want a more visual debugging experience and shared a fun case study of Mateusz from Stately debugging XState using replay.
Changelog
We launched Dark Mode. We published two comparison blog posts to Chrome’s Recorder and Session Replay, and we highlighted one of early customers, Dynaboard.
Changelog
We shipped Focus Mode! Our designer, Jon Bell walks through the design process and we share some other updates as well as a case study on our Jest proof of concept.
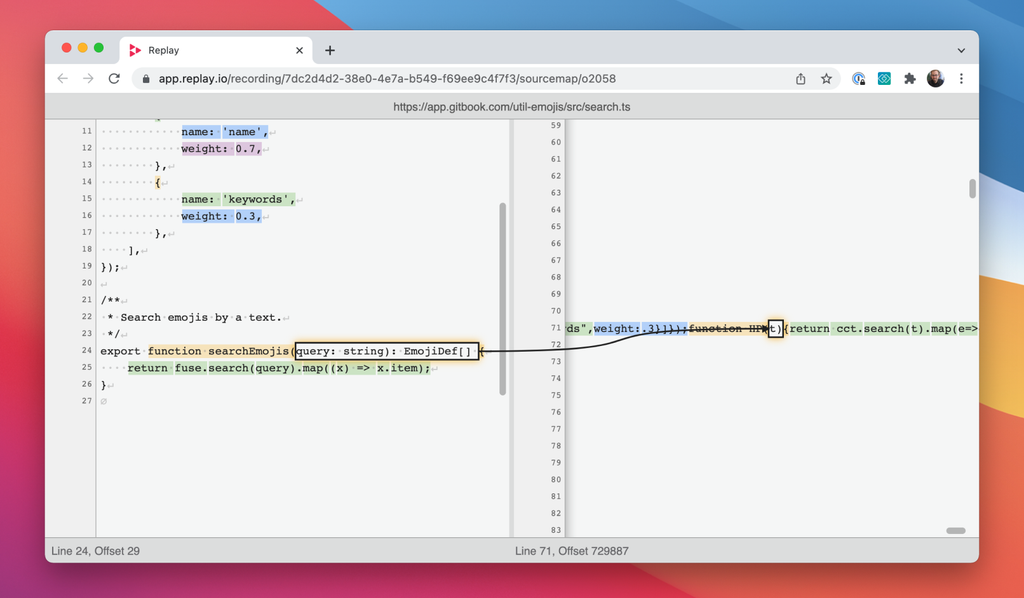
We shipped Source Map Visualizations (thanks Evan Wallace). We shared a case study of using replay to fix an issue in Excalidraw.
Changelog
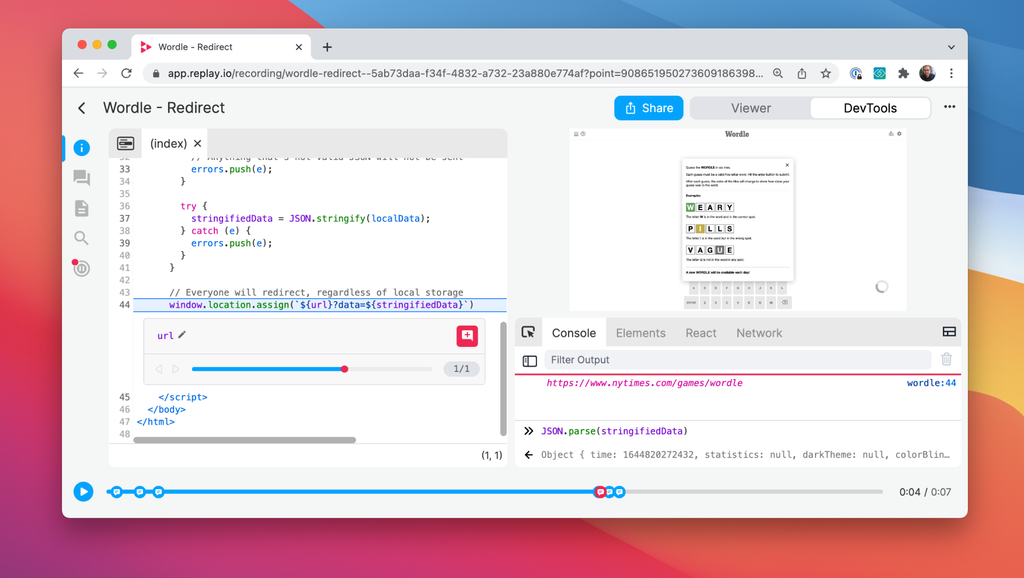
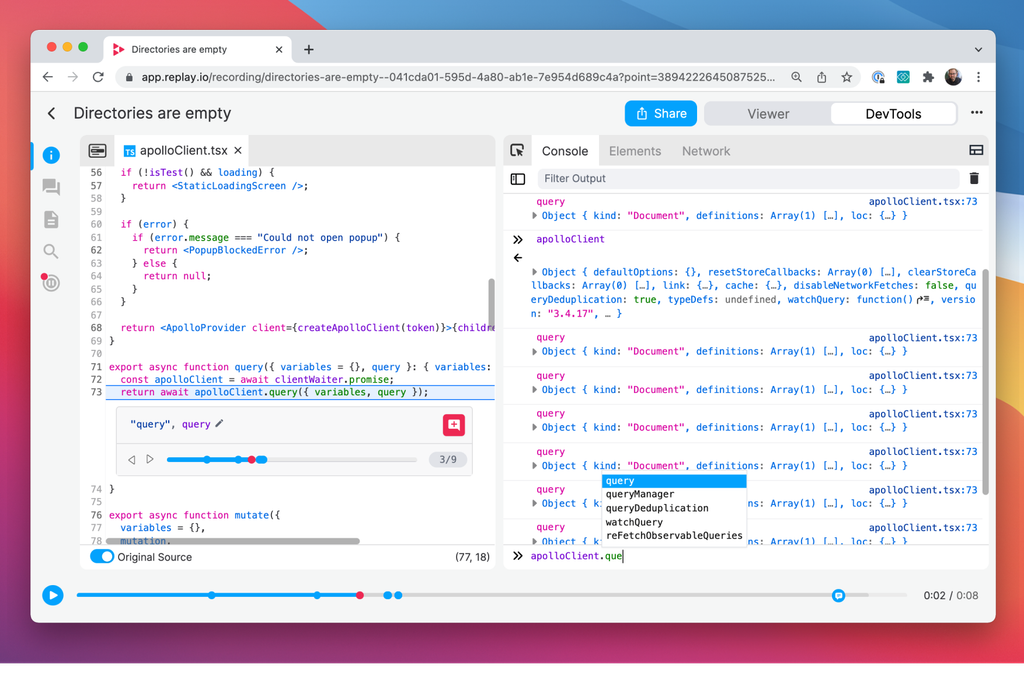
We shipped Eager Evaluation. Mark Erikson joined the team! And Vercel’s Guillermo Rauch uses replay to see NYTimes’ seamless redirect on Wordle’s original homepage.
Story
Mark Erikson joins the team!
Changelog
We shipped Autocomplete! And we found a bug in seamless.com and made a replay to show where wonton soup could not be added
Changelog
We hit a milestone with bug reports since our public launch! Our Community Lead, Cecelia Martinez, uses replay to fix her first bug and we shared Geoffrey Litt’s debugging session.
Changelog
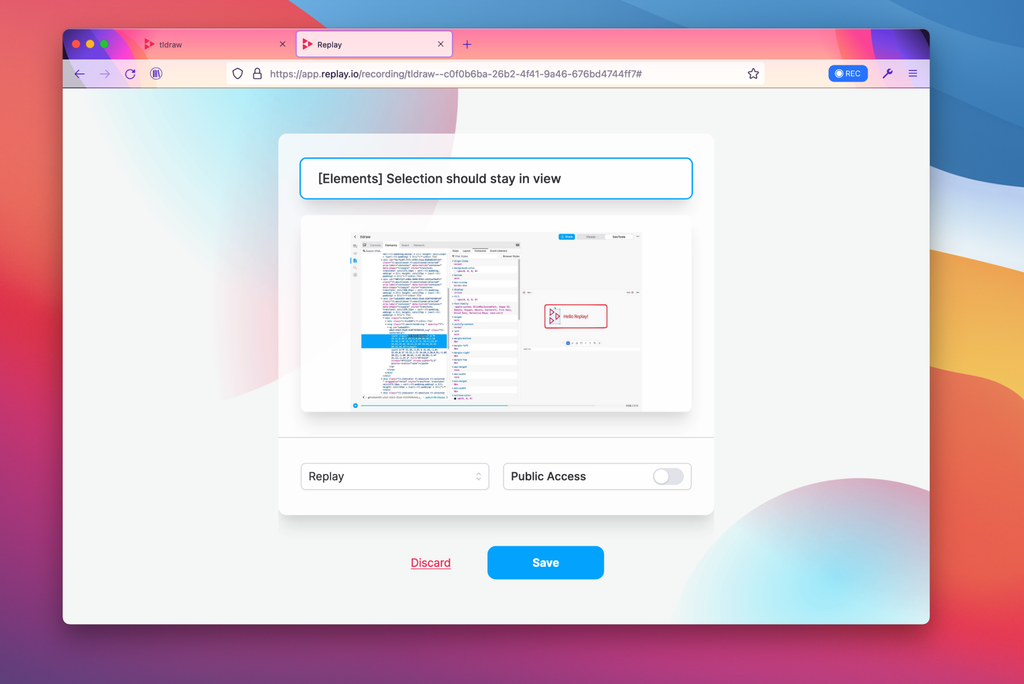
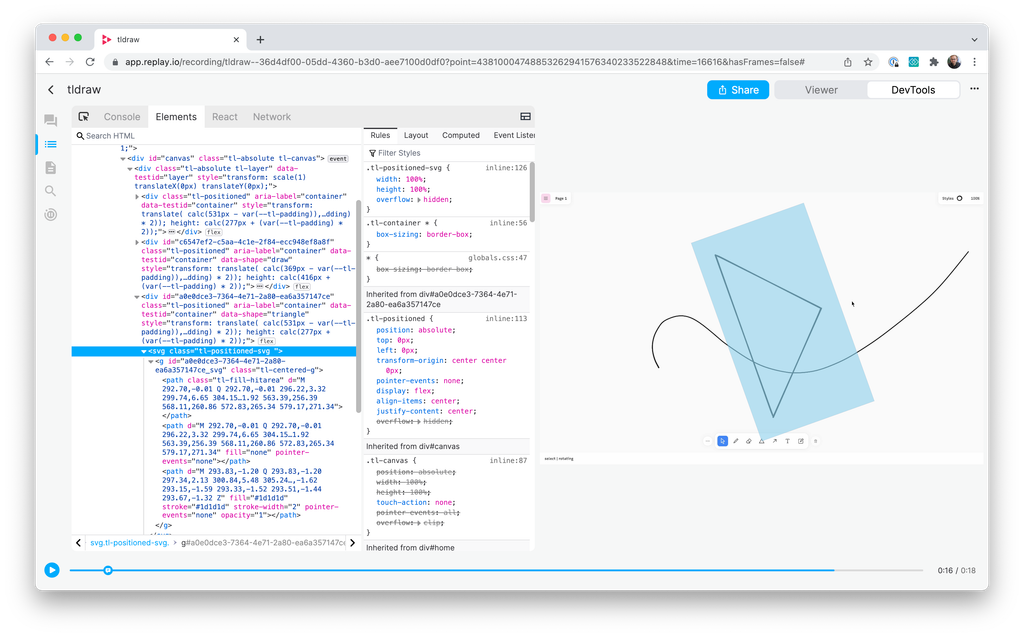
We launched the Elements Panel! We shared some updates on autocomplete and start times then highlighted a case study with Steve Ruiz who used replay to debug tldraw and its packages
Changelog
We shipped Network Monitor Request and Response bodies and shared some fun culture updates like our Smile File 😃
Changelog
We released a new version of the Replay browser based off of Firefox 91. We shared updates to our elements panel, and a case study with Paul Shen who sued replay to debug natto.dev
Changelog
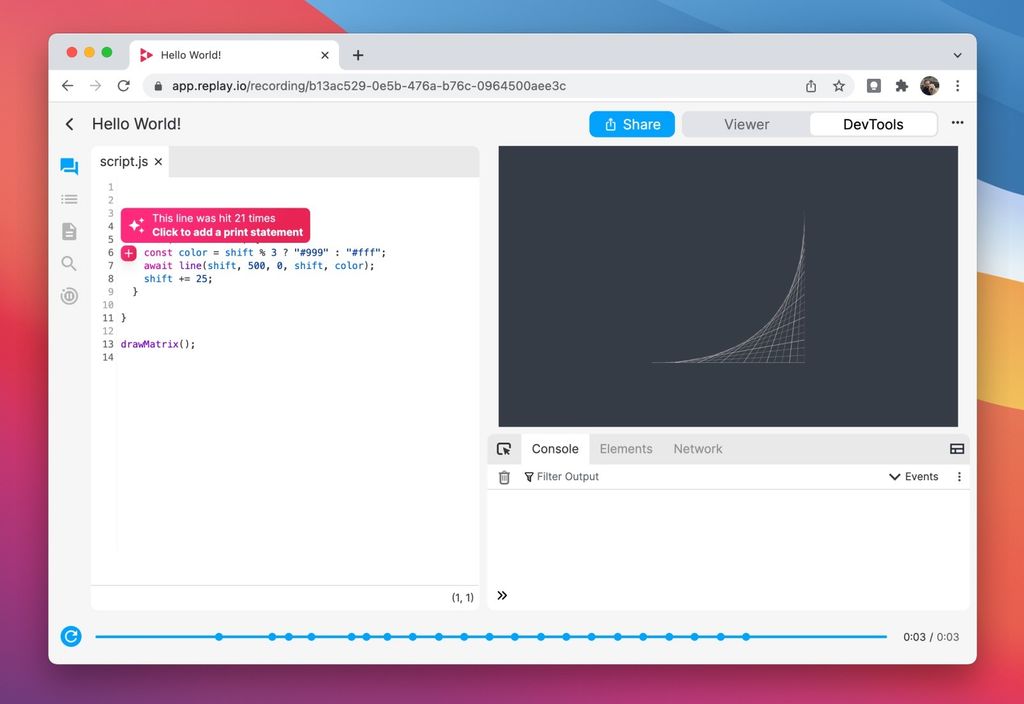
We shipped Print Statements - a new in-line action reimagining print statement debugging.
Changelog
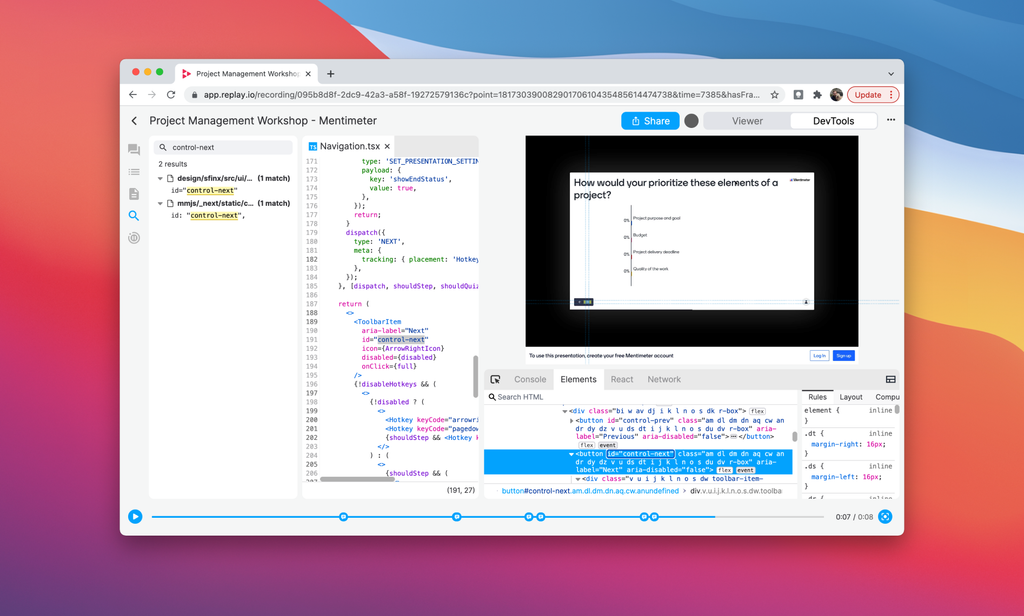
We shipped Function Search, added a new Command Palette and shared a bug fix example from Jason at Glide in their canvas spreadsheet editor.
Changelog
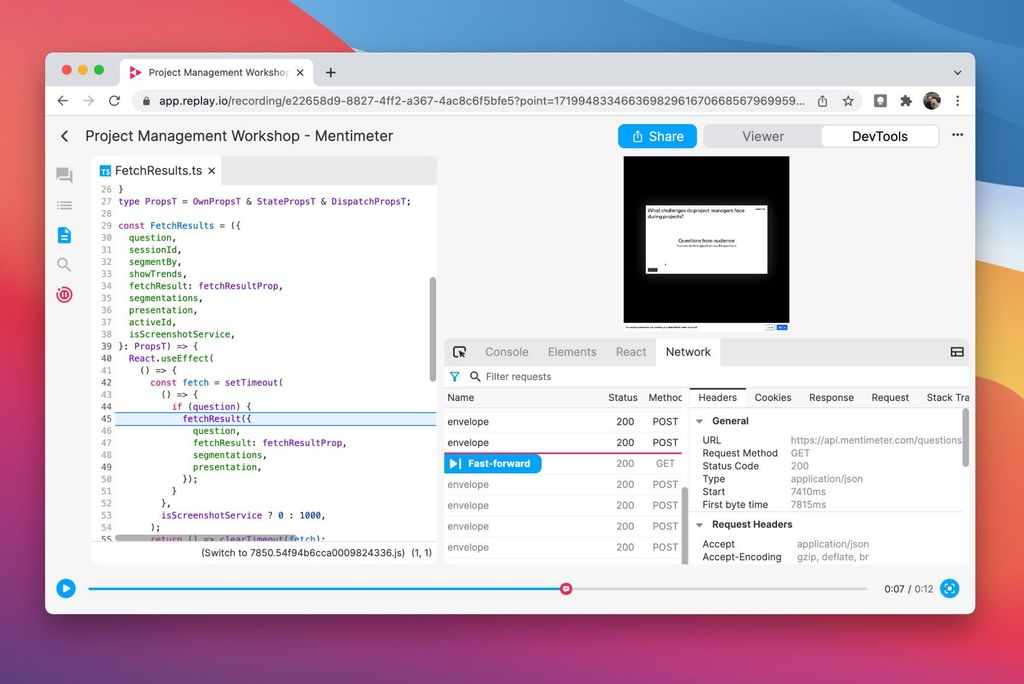
We shipped an early version of the Network Monitor 🚀. And we shared a story of how the new Outline View nearly didn’t ship because we were having a lot of issues with React hooks and memoization.
Changelog
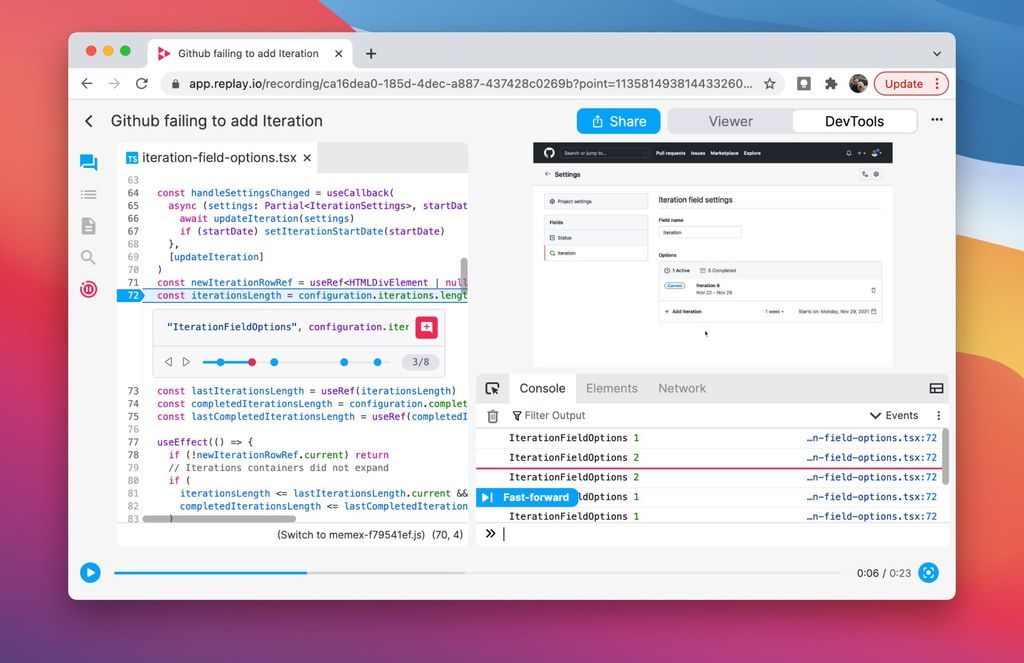
We announced On Demand Paints, a big breakthrough! We also shared a bug fix with GitHub’s Project Iteration Field Settings.
Changelog
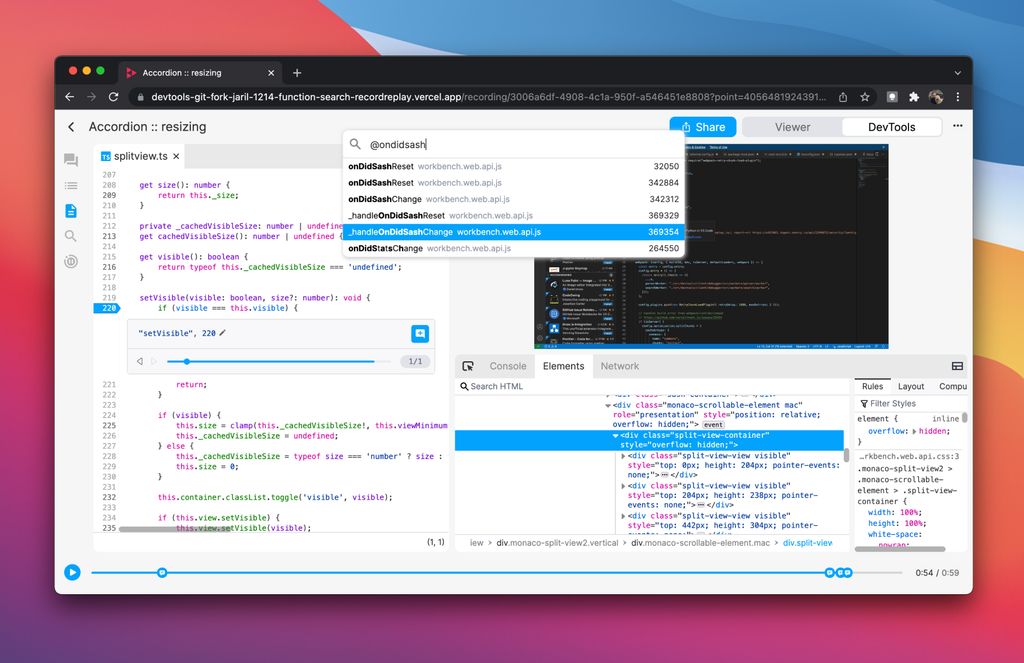
We revamped Full Text Search. And we sent a big thank you to our early adopters, design partners and highlight our discord, design journal and GitHub discussions.
Changelog
Changelog
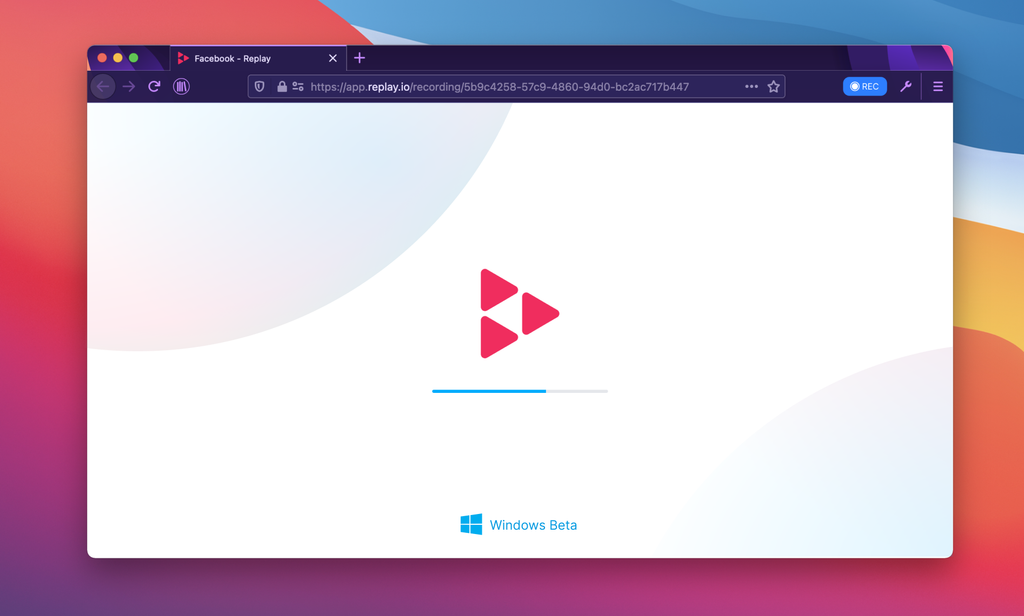
We shared our collaboration roadmap, some updates like our Windows beta and a case study of us testing top sites in Playwright e.g. Facebook and found 4 bugs in the process!
Changelog
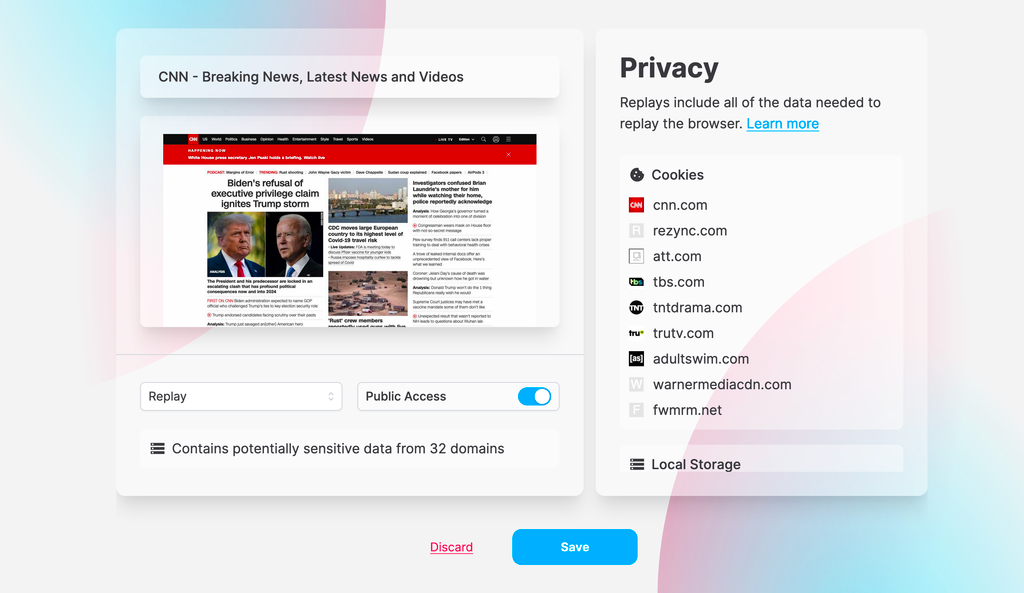
We shipped the Privacy Panel. Replays are private by default and we follow industry standard for security practices since day one.
Changelog
We launched an early version of our Windows browser and shared some other improvements.
Changelog
Changelog
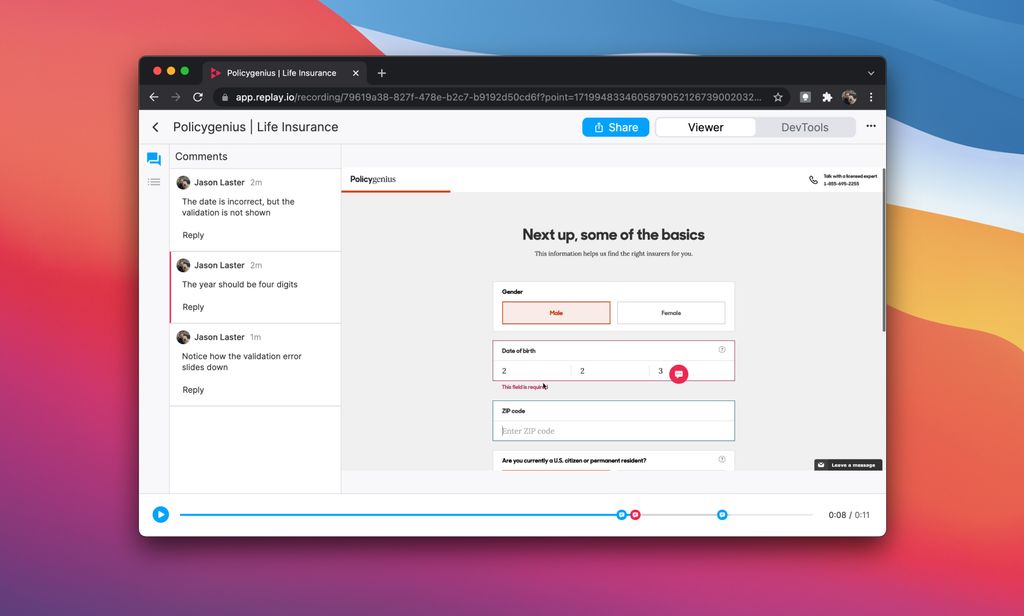
We refreshed Replay’s UI making it easier to leave comments in the code and follow conversations in the sidebar, and also added a whimsical coat of paint. We also highlighted a case study with Databricks’ Notebook team.
Changelog
We shared an update three weeks after our public launch!

Our public launch!
Tech
Or, How I spent 2 hours arguing with myself over Safari

A new Teams UI!

Our first changelog summarizing our focus on the onboarding experience.
Changelog
We summarized user feedback and shared an early look at how much time you’ll save not having to reproduce issues locally. We shipped a new recorder and breakpoints panel.
Changelog
We talk about the scientific method as an analogy to successful debugging.
Changelog
We compare time travel debugging to Instant Replay and share some product updates.
Changelog
We talk about our feedback loop with users.
Changelog
We talk about our beliefs and assertions that led to the creation of Replay.
Changelog
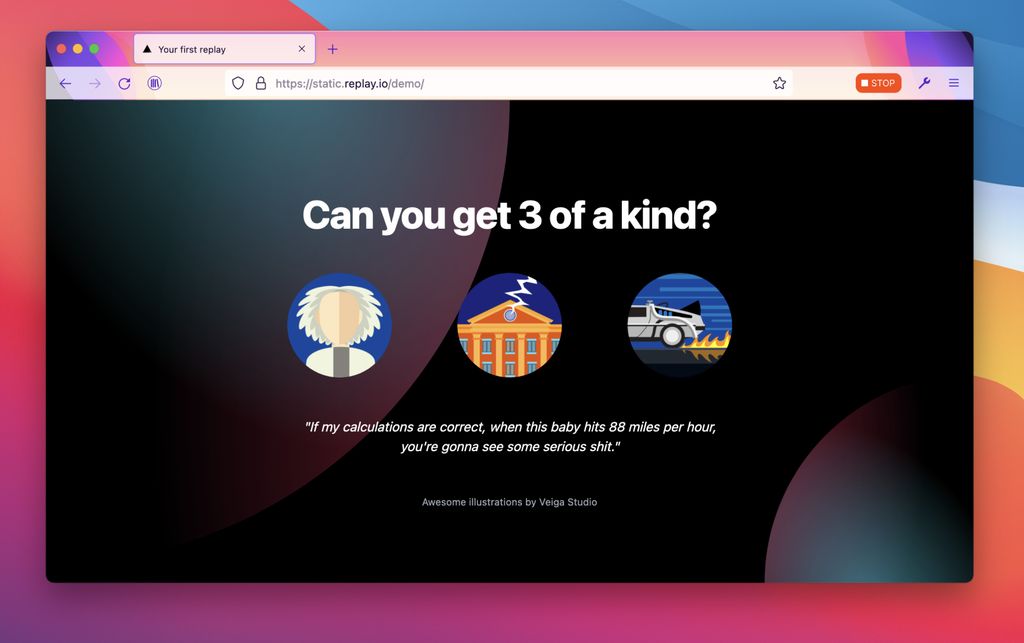
When we started Replay, we had a hunch that the best way to understand software was to record it and explore it after the fact. It's been super gratifying to hear that Replay has already helped folks